Weekly Gold Markets
The Golden Wall of Worry
Historical Correlation Between USd & Gold
14 May 2005
A gold & currency digest
By Ed Bugos
| Print Copy | ||
| Today's Highlights: | ||
| Every productivity boom has been considered better than the last one |  |
|
| Analysis: the latest trade data and money supply behaviors | ||
| Another brick in the wall | ||
| Putting the foreign exchange issue in its right place | ||
| Wages: guess who's paying for this boom | ||
| The historic correlation between Gold and USd index | ||
| Conclusion | ||
“A degree of productivity has emerged, ‘which surpasses by far all previous ones’” – Ralph Raico quoting John Prince-Smith (1809-1874) in a contemporary article discussing the rise and fall of German Liberalism (in the classical sense Liberalism meant what Libertarian means today) during the 19th century.
Funny how tired that phrase is, eh? – Mr. Raico might as well be quoting half the guys at the Fed today.
Prince-Smith (who was not really a prince) was the foreign born leader of the German free trade movement from 1840 to 1870 and a highly influential economic advisor to Otto von Bismarck, who instituted his suggested reforms until a few years after his death when Bismarck “dissolved the ‘pact’ with the free-trading National Liberals, and turned to protectionism and state-socialism.” Raico wrote of Prince-Smith (link below), in pointing out the weakness of the German ideal of liberty, that he fell prey to the “Pareto Syndrome,” which is the name given to the propensity for the leading liberals of the day to choose to fight socialism by embracing fascist and imperialist totalitarian ideologies, as the lesser of two evils.
Although he believed that freedom meant freedom from the state, and so favored limited government, he and his free trade party ignored the constitutional issues, since they thought that: “Political rights were at best instrumental values, serving to bolster the fundamental rights, especially the rights to property and contract.”
As Raico further wrote of his clique, “Their highly limited and thoroughly economically-conditioned conception left no room for any strong interest in working to install concrete constitutional barriers to government power — these would emerge on their own, as a consequence of the advance of the economy.”
In other words, constitutional guarantees that protected private property from the clutches of the state were considered dependent on economic freedom, apparently even if without a guaranteed one – he and his followers were content with the nominal nature of private property that Bismarck allowed.
But in his later years, Prince-Smith abandoned the minimalist state conception as a practical goal altogether – i.e. he abandoned his Lockean/Bastiat philosophical influence to his Bentham/utilitarian roots.
In the end, notwithstanding, his strategy proved to betray even his sole aim (that of establishing economic freedom) – Bismarck changed the rules as soon as circumstances occasioned it, shortly after Prince-Smith’s death in 1874. The gist of the author’s criticism of Prince-Smith’s strategy could be summed up in the following quote, in which he quotes Eugen Richter who was the leader of the Progressive Party which formed after splitting with the Prince-Smith camp – who formed the National Liberal Party – over the Constitutional Crisis of the 1860’s in which the government of Wilhelm I lobbied for more military spending… both the progressives and the national liberals were for private property and free trade but Richter’s camp didn’t want to compromise by allowing the state to use war as an excuse to grow:
“The cornerstone of Richter’s social philosophy was the interdependence of political and economic liberty. As he put it, ‘Economic freedom can have no security without political freedom, and political freedom can find its security only in economic freedom.’” Richter believed in parliamentary government and molding public opinion as the only route to both, while Prince-Smith embraced the lesser of two evils, as a matter of utilitarian pragmatism. I must recommend this phenomenal article. There is much to learn from history; it is interesting how the struggles we face today are the same kind that people have always faced… I could go so far as to put it this way: Germany (and perhaps much of Europe in the 19th century) has already made the mistakes, first, which both Canada and the United States in varying degree are making today:
http://www.mises.org/story/1787
History never repeats itself, exactly.
-----------------------------------------
In today’s
letter I will discuss the effects of the latest trade and money supply
figures on the US dollar and gold prices, with a special concluding focus
on the correlation between foreign exchange and gold – don’t
miss it.
One of the reasons I chose to post an allocation that includes buys and sells for commodities and currencies, besides the fact that some of our clients trade non-equity, is worthy of elucidation at this time, because it is of value not only to those who trade them. It is to emphasize certain facets of my outlook via a rational basis of action.
For example, I might say a lot of things about oil or the Euro or interest rates or gold but it is only when I act on the allocation that I expect to be taken seriously – the rest of the time it’s hypothesis and speculation. The downside is that the allocation is also considered a measure of my performance; and currencies, bonds, or commodities tend to be relatively less volatile than stocks when you take out the leverage factor, which I do. In any event, the main reason I mention it is to emphasize the significance of our recent actions – in selling the other commodities and closing out my currency bets against the US dollar, thus implying a less bearish outlook for the USd and a less sanguine outlook on the non gold commodities – yet remaining bullish on gold itself.
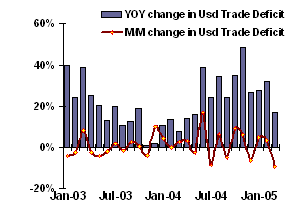 The
significance of it lies in the fact that I still expect gold to rise,
a lot, this year regardless of whether the other commodities rise or fall,
and whether the US dollar rises or falls. A related call was that we expected
the trade deficit to stop widening at its recent pace, which it has been
doing (see graph to the right – all graphs are updated for the latest
release), and maybe even to contract – for a time – which
it may have started to do – even though we know one number doesn’t
make a trend. Thursday’s drubbing in gold came on the heels of the
latest in a string of dollar bullish news reports – the US trade
deficit shrank 9.2 percent to US$55 billion.
The consensus, which is always easily conditioned by long established trends, reportedly expected a further small rise in the number. In any case it was the largest month on month contraction in a number of years (it might be worthwhile to note that the USd index was weak in March, and hence the April and/or May trade figures may show growth) – other good news for the dollar came from last Friday’s release of the April employment situation, and also perhaps the retail sales figures this week.
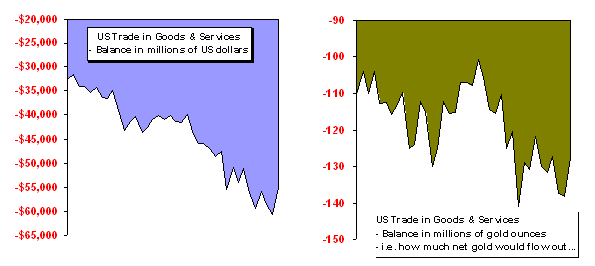
One of the main factors that has been convincing me of the possibility that the trade deficit may not grow as much in the intermediate term (and perhaps contract) involves the behavior of the monetary aggregates that I watch for the biggest 5 central banks: the Fed, ECB, BOE, BOJ, and RBA (Australia) – I also monitor the Bank of Canada’s monetary “conditions” but not as closely due to the difficulties of acquiring the right data – our bank has reportedly abandoned the notion that changes in money supplies matter one iota, but I won’t quote the genius at the bank who told me that, or divulge his name… out of sheer pity let me assure you. Anyway, note that in the two year period immediately following the year 2000 (below) that the growth in the Fed’s broad money category (M3) was at the high end of its range and of the group’s but then subsequently fell. Note also the push in narrow money (M1) during 2001/2002, which too has cooled since. These bouts take time to work themselves through the economy and prices – the stock market rally that started in 2003 was one result (which boosted recovery sentiment), the trade deficit was another.
Since 2002 the growth in Fed money has continued but at a more modest pace now, more importantly, relative to the others.
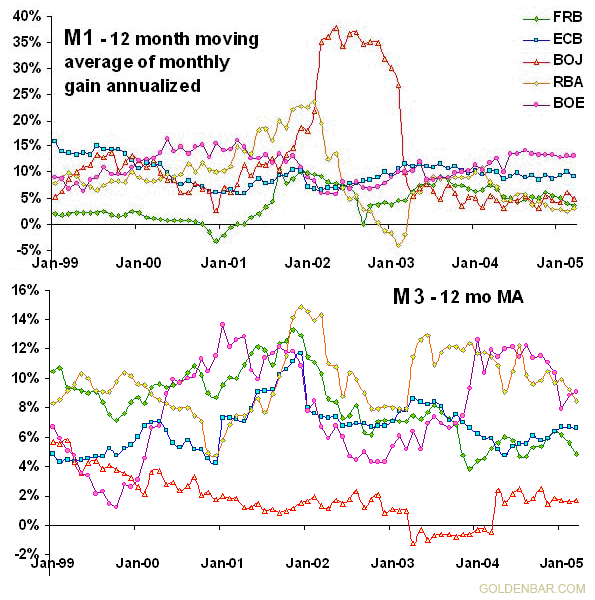
Of course, inflation hasn’t stopped, and at the current reduced rate of growth in M3 (see table below) it still amounts to about US$500 billion of new liquidity annually.
In March M3 grew at only a 1.7 percent annualized rate – which is just a third of its 12 month moving average – but in April preliminary data show a surge of US$75 billion in M3 for a 10.3 percent annualized gain on the month, or twice its average (the Fed tends to release its figures up to a month ahead of everyone else, which is why the table is for March). This will continue to have an impact on capital structure, and the value of the Fed’s money in relation to commodities and other goods.
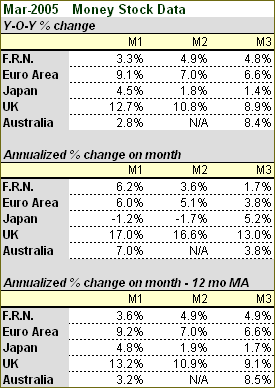 The
April increase in money supply was the strongest increase in twelve months,
but it’s interesting additionally because we’ve been anticipating
it – as a result of a response to the weakness in the stock market
(yes, the Fed targets stocks – but tacitly – why
else did they push up those inflation rates in 2001? – no the market
didn’t do it on its own, the drop in rates did).
However, as encouraging for gold as are April’s preliminary estimates for US money supplies, since the end of 2003 most of the other foreign central banks with one quasi-exception have pursued polices up to twice as generous.
Apart from the enormous increase in narrow money (M1) in 2002, the Bank of Japan has been the most conservative inflation offender of the bunch but there was a noticeable pick up in M3 in March; the ECB took a breather in March but is still growing broader measures at about one and a half times the Fed’s pace; the BOE has continued to top the others, which it has been doing for well over the past year… it is growing money at nearly twice the rate everyone else is, on average… only the Reserve Bank of Australia has a poorer record of inflating these aggregates over the past two decades than the BOE.
Hence, for the past year we’ve known that it has been only a matter of time before the effects on prices ought to result in foreign exchange reversals… but the only significance this should have on the gold price, in my opinion, is that the foreign currency price of gold begins to rise faster than the USd price of gold.
This would simply reflect a situation in which the real value of the US dollar would fall but at a slower pace than the real value of other currencies for the time being, in which gold still advances against all the currencies, until the Fed next panics – you will see the historical as well as rational basis for this today. Whereas the US inflation boost of 2001/02 may have already made its way through the US economy, the overseas push is younger – the dynamics merit a correction of some kind in the USd and trade deficit, unless the currency recovers too fast. Indeed I’m not sure it can all turn around on a dime – I still expect a lower low in the USd index this year even if only a marginally lower one – I still expect a choppy FOREX market – but a two point rally in the USd is likely.
The Wall of Worry
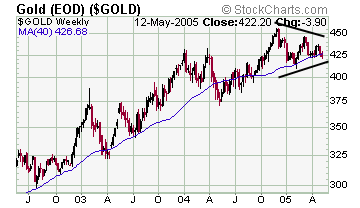 Notwithstanding
all of the inflation produced by the central banks around the globe (since
we all live in a yellow submarine), the gold bull market has been fickle
following on November’s break out – it has lots to worry about.
However, before discussing the psychology I want to be clear on this fact: even if the bears are right in the next few months, the current pattern is NOT a rising wedge! We’ve ruled that out on account that a rising wedge by definition must be accompanied by a petering out of volumes and open interest, importantly: on each higher high. It is true that volumes have shrunk in recent months but that’s occurring within the period covering the 5 month triangle/consolidation that has become apparent on the chart – and not in the large 15 month period covering the area that most technicians might hastily deem a rising wedge. Moreover, on the November break out, which was the last highest high in the trend so far, volume and open interest expanded markedly – it was a genuine break out as far as that can be said.
A rising wedge is characterized by falling volumes on each higher high.
Still, the “genuine” break out could be a fake, but if so it is part of a pattern that isn’t visible yet – unless one were to presume that the five month triangle marked in the graph here were to represent the top of a primary trend, one that is in fact at least two years longer than the current stock market recovery trend. I’m skeptical.
At this point the five month triangle implies just a short term move of some US$40 in either direction – things like this of course are far from 100%, they only sharpen your edge a little – it is a neutral pattern – its break down point (signaling a US$40 slide) is February’s low at about US$410 and its break away point (signaling a US$40 advance) is the November/December high at US$455, which seems far away today.
If it is a short term top, the implied objective at about US$370 would bring into focus a much larger head and shoulders topping formation that would be two thirds complete on such a move, and which we’d have to take more seriously.
If it were a rising wedge, and especially the kind that I see painted on the chart by other technicians, it would imply a more serious breakdown of at least US$100 points – but it is usually the Elliot Wavers that missed the move to the upside so far that tend to chronically interpret this chart bearishly, and badly if I may say so.
I have fundamental reasons not to expect a long term top to form at this stage, at least not with US$455 as the high for this leg. So that’s another reason I don’t believe we’re going to US$370. But in any case, I had regarded the triangle as a normal – though maybe a little lengthier than normal – retracement following on a break out of some significance as this one was, and I was convinced that the bullion market could withstand the bearish current in the equity sector, which I am aware normally leads bullion, for reasons already discussed. However, the break down through the 200-day moving average on Thursday, and then through April’s low on Friday as the gold shares continued to plunge is a bad sign. Some technicians would already have jumped on it as a breakdown because it fell through the previously upward sloping line that defined the triangle. This could prove the right thing to do. At this point it feels like a 50/50 bet, given the length of time psychology tends to diverge from reality these days.
On a less bearish note, it is possible that whatever pattern gold is developing has not revealed itself fully yet – in other words instead of a triangle it is possible that it is going to be just a typical correction (like a downward sloping trend channel) within a sequence of two or three lower lows against the primary trend that nevertheless doesn’t penetrate US$395/$400 – that and support at the February low – or a sudden upturn on Monday – are the only bullish possibilities I can hold out at the moment for the short term. There are at least three distinctly bearish facets of the psychology that is stacking the wall of worry:
- It is hard to deny that there is a good chance commodity prices have peaked on this leg of their general bull markets, and it looms for the gold outlook as an axe hung overhead by a thread might – underlying this view is that if the stock market declines, investors buying up commodities on the basis of the economic growth argument (rather than inflation) are likely to turn into sellers and bet on deflation – rather than betting on the more likely outcome, such as another bout of Fed inflation in response.
- The foreign exchange value of the US dollar has been grinding higher (we said it would be choppy this year) in its most convincing manner in over 12 months – backed by good news on jobs, the economy, the trade deficit, and a Fed that appears to be tightening the screws… until you look closer anyway.
- The gold shares are getting clobbered – they represent one of the weakest sectors in the stock market averages these days – with an underperforming commodity in the backdrop – and they usually lead it.
I say psychology because the fundamentals are bullish, and I’m trying to explain the bearish activity that is apparent in the tape – if it just mirrors the psychology and the psychology is ill-founded then it’s a buy, right?!
In today’s report I want to elaborate on the second point above: the foreign exchange value of the US dollar. I’ll cover the inflation/deflation outlook more in depth in my next issue, and we all know what’s troubling gold stocks: operating costs, an underperforming commodity, and environmental attacks – even unfounded ones. Big surprise.
In any event, the way that gold prices would respond to a general commodity liquidation has been discussed in prior issues but I’ll bring it up again briefly in today’s conclusion.
Putting the Foreign Exchange Rate
in its Rightful Place
The main fallacy I want to explode today is the correlation between gold
and the foreign exchange value of the US dollar. Let me start by quoting
a recent paragraph from Dow Jones epitomizing the common thinking:
"Confidence is building among gold traders and analysts that the widening U.S. twin deficits will keep the U.S. dollar under pressure for at least another year or two, setting the scene for gold to resume its upward trend... 'gold and other precious metals continue to take their cues primarily from the U.S. dollar'" - DJ newswires, May 8
This was taken from news before the trade deficit figures were released. You could imagine that if the reporter knew the news ahead of time he might not have made a bullish call on gold at all, even implicitly as it is here.
But in any case, there are at least two relevant fallacies in that paragraph.
- Trade deficits don’t actually pressure the currency except to the extent people buy or sell news of past events (trade deficits arise from the effects of relative inflation rates on money prices given the nations concerned); and budget deficits, as you know, can attract foreign investment, at least if the government knows enough that it doesn’t want to crowd out domestic borrowers and push up interest costs.
- Gold does not take its cue from the foreign exchange value of the US dollar – or at least it hasn’t prior to 1997 as I’ll show today – and even post 1997, we’ve shown technically that gold leads the USd as often as gold shares lead gold – the currency is the dependent variable – the foreign exchange value of the US dollar is but one component of the gold outlook, perhaps only marginally more significant than the effects of things like war and doom on the main trend. A weak currency can be more easily hidden from view if the other currencies are more heavily inflated but it is not strong just because it isn’t perceived.
 So
when the average trader saw the trade figures he/she immediately bought
the US dollar – not acknowledging that the correction in the trade
number occurred at a lower level for the US dollar index and that the
Fed has pushed up its inflation rate since – in April – and
not thinking that the news only reports what already happened, and that
if it is to continue happening a strong currency on the foreign exchange
market in light of an easy Fed would stop it. We see this psychology in
the tape, and I’m reading it in the papers.
It’s there even among pros.
Nevertheless, the main treatise today is not to debate a USd bounce, which is possible for technical reasons, but rather to show you why it is possible for USd gold prices to advance markedly, even if the foreign exchange value of the buck strengthens more than I anticipate at this stage, by referring to the evidence provided by the last historic bull market in gold. The first consequence of brainwashing that people must repeal is the notion that the foreign exchange value of a currency represents the local or main value of money. The value of the dollar is measured against commodities and goods as well as foreign currencies. Imagine two economies that are identical in every respect even including their respective inflation rates (in money supply). The foreign exchange rate of their currencies would be lifeless, at least in such an unrealistic example. But the prices of other goods and services, wages and stocks, as well as commodities would rise if there nevertheless was a constant flow of inflation – working against the productive forces of the economy I might like to add.
Only in this example they would rise at exactly the same pace in both nations. In reality the different inflation rates and the myriad of other differences between trading nations affect prices in a non-uniform manner, as does the inflation itself in each currency, which is the source of most trade opportunities. But getting back to the main point, recall that foreign exchange markets are really only the mechanism through which the loss in the real value of each currency (i.e. its commodity value as well as its value against all goods locally) is adjusted against the other – for the purpose of this definition the assumption that they always lose value is hardly deniable – until there is no benefit to buying a commodity in one currency for profits in another. The fact that the press is glued to the view that the foreign exchange value of the US dollar is the only one that matters for gold is a fallacious interpretation worth exploiting. It is particularly appropriate given that historically, at this stage of the gold advance, gold is likely to explode in all the currencies… it is appropriate that the public is keyed off the foreign exchange value in other words because big moves happen when no one expects them.
The Historic Correlation between
Gold and the USd Index
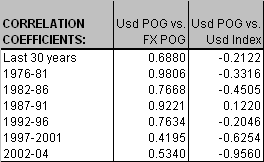 The
correlation between US dollar gold prices and the FX value of the US dollar
has tightened markedly since 1997, as you can see in the table here of
the correlation coefficients between the USd price of gold and the average
FX (foreign currency) price of gold going back to 1976. In
other words, when for instance the USd gold price is highly correlated
to the foreign currency price of gold (like in the period between
1976 and 1981; and during the post 1987 crash) it can be so only
when the foreign exchange rate is relatively stable. You can see this
also in the correlations between the USd index and the USd price of gold
in the final column - which are stated opposite, thus less counter-intuitive.
Either way it is obvious that the correlation between gold values and
foreign exchange rates was mildest during the late seventies, late eighties,
and early nineties – generally around bullish gold moves. But, the
difference between this correlation before and after the year 1997 is
most striking – there has rarely been a period in which it has been
so strong since the US dollar has freely floated.
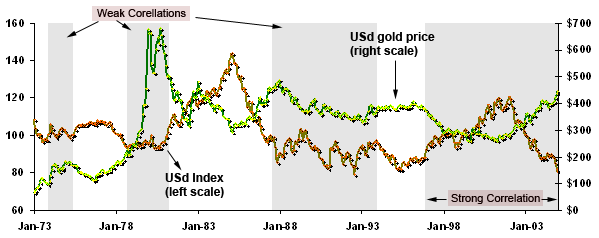
Still, the main point is that some of gold's most important moves, historically, have occurred while the FX rate was stable. In the chart above you can see that (the US dollar data is from the St Louis Fed's site) after the initial hit to the foreign exchange value of the US dollar in the early seventies (only the tail end of which is shown here) in the final two years of the 1971-75 gold run the USd index traded sideways while gold prices rallied another 70-something percent; and similarly that during the final leg in gold - i.e. during 1979/80 - the metal still returned better than a threefold gain on almost no change in the USd index. If the correlation between the USd gold price and its foreign exchange rate was strong over the long term you would not have such significant losses in the gold value of ALL the currencies. Finally, it is interesting that the correlation was weaker during the bull market in gold and especially during the latter stages of the advance! Hence if it is a bull market now then we should be right about gold blowing past US$500 here even if the USd index struggles to make new lows.
Conclusion
Prince-Smith was a traitor! Just kidding, I think. I didn’t know
the guy.
It is not the twin deficits that are keeping the USd under pressure so much – except at the psychological margin or as we usually say, the short term – as it is 1) the relative inflation policy of the Fed, 2) the US dollar's losing luster as a primary reserve currency (confidence), and 3) the relative underperformance of US assets.
These are the main things that have caused the US dollar to lose real value faster than its peers over the past few years. You can add things like Bush and his protectionism but I would simply put that in category #2.
The only bullish facts for the US dollar (FX) at this stage are 1) the behavior of the monetary aggregates over the past year favoring the US dollar over the main European currencies especially, and 2) the political factors surrounding the EU Stability and Growth Pact, perhaps including the French referendum on the EU constitution.
 These
things will likely tend to help shrink the US trade deficit and support
the foreign exchange value of the US dollar in the intermediate run. But
the regulatory environment in the United States and the maturity of its
central bank is likely to keep the economy less competitive over the long
run, particularly as other countries embrace the free market order, and
therefore is a long term bearish factor for the foreign exchange rate
of the USd.
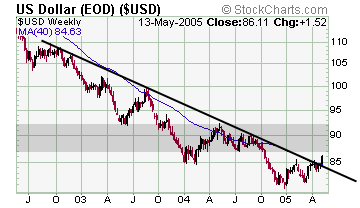
My short term outlook for the US dollar went to neutral in late March for technical reasons, which means that it could rally a few points from where I went neutral but not significantly and it would probably not hold long. The bulls should be counting on a rally to or past last year’s high at around 92 (top end of the shaded region in the graph) following on the break out from a six month ascending triangle; the bears are likely expecting the rally to stop short well below 90 before plunging to new lows.
I happen to think that the slope of the trend line will be less steep, conforming to my “choppy” outlook, and the less bearish intermediate outlook for the currency.
I still think that there is downside to the foreign demand for the US dollar emanating from short term events, like a rollover in stocks and a ramp up in monetary inflation.
I’m not sure the bulls can get the kind of traction one would expect to result after a 30 percent plus dive in the currency – because while sentiment certainly snowballed bearishly over the past few years there has not been the kind of selling climax that has turned everyone bearish… there has been bottom fishers all the way down this thing.
I’m not saying that it has to end in a selling climax absolutely, only while there is no lengthy bottom – i.e. if the currency were to bounce around in a range for the next year or so then I would probably have a different viewpoint on that.
The kind of sell off I expect to see in stocks and bonds, simultaneously, has tended to be bearish for the currency historically and has often produced that kind of exhaustive selling climax that set it up for a reversal. That’s all on the dollar.
As for the gold sector, I’m plain bullish short term, intermediate term, and long term. This move isn’t over until the Fed is forced to tighten – IT CAN’T BE SAID TO BE TIGHTENING IF MONEY IS GROWING AS FAST AS EVER!
At this stage the inflation (or liquidity in the Fed’s language) that is flowing through the system needs to be ramped up if the so-called stimulus is to remain effective in persuading folks that the recovery is real. The Fed can’t afford to consider a real tightening. Meanwhile, the foreign currency price of gold, which has languished for two years while most foreign central banks jacked up their money growth rates in response to their strong currencies, is obviously undervalued. Gold’s technicals are showing a bearish bias without full confirmation for a downside move yet.
Gold bulls are facing worries over a potential reversal in the foreign exchange rate of the US dollar, declining commodity prices, a tighter Fed, the bearish climate for gold mining and collapsing gold shares, and either all out deflation on the one hand or the possibility that we underestimated the strength of the economy on the other.
The only worry that would be legitimately founded in my mind would be the very last one – the possibility that we have underestimated the strength of the US economy.
But I am doubtful of that in light of recent equity developments and the overall fundamentals as I see them. The fundamentals for gold are bullish – whether we’re talking about the supply & demand data or the monetary outlook. The still permanently bearish sentiment, the low level of the gold ratios (i.e. gold relative to other commodities), and the general denial about the nature of the boom make being bullish on gold especially attractive at this moment. I’ll defer my comments on the gold shares for my next issue once I’ve done my research on the week. But the fact that I remain so bullish on gold prices combined with the extent of the gold stock declines put them at a seriously attractive long term buying point from a fundamental point of view, and a better than average short term position from a technical point of view.
The way I see it, the action in the gold stocks is related to news that is unrelated to the gold price itself and if anything is simply adding bearish sentiment to trade in the metal.
The golden wall of worry is certainly steep enough, but I believe it will be scaled.
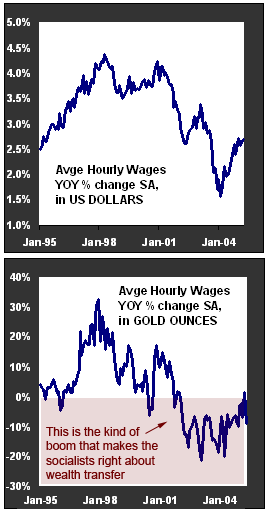
I am confident that it is a bear trap, that gold is undervalued in relation to everything, that the Fed can’t afford to tighten, that the real value of all the currencies is going to keep falling, that some bounce in the US dollar’s foreign exchange rate is not a meaningfully bearish factor, that a decline in stocks may be bearish for commodity values but bullish for gold values as it prompts an easier Fed, that actual deflation is seriously unlikely, that the post 2002 economic boom is a farce (Exhibit A would be the chart on wages above), that the supply situation in gold is worse than oil, that the trade deficit won’t determine gold’s fate, and I believe that US$395 will hold. I’m not sure if it will be tested but if it is it will happen in the next two weeks. Nevertheless, I am confident that there is much more upside to gold prices, in the near term, than downside.
P.O. Box 4642
V.M.P.O.
Vancouver, BC
Canada
V6B 4A1
Phone: 1-604-941-7059