17 September 2002
Printer Friendly Version
What if the major stock market averages were to trade in a wide range over the next 15 to 20 years, between 6000 and 12000ish on the Dow for instance? Could you name that tune?
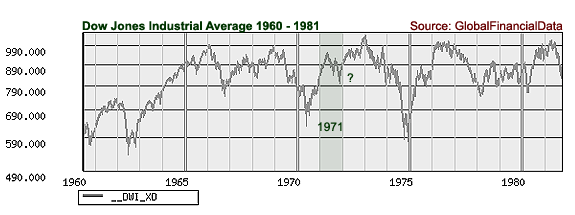
We can. It's the seventies theme where the 1966 top at 990 proved to be the secular bull market top capping the prior 20-year bull market cycle that began arguably after WWII. Although it was challenged three more times before finally giving way to the bulls in 1983 (it was briefly pierced when bulls printed the Dow at 1051.70 at the beginning of 1973), it's hard to argue that the 1966 top wasn't the most important one for long term investors (see chart below).
The 15-year periods between 1966 to 1981 and from 1931 to 1946 are the only two in the 20th century where the averages are recorded to have traded in a wide sideways range for as long. In the thirties this action occurred well below its peak 1929 levels, so we can't really say the prior bull market ended in a long term sideways range. For instance, from 1934 to 1946 this range could be defined between 100 and 200 (DJIA values). But the Dow's peak value in 1929 was 381. In the period from 1966 to 1981, this range is most commonly defined to be between 535 and about 1051. The top end of the range thus matched the prior bull market top. In both instances the bottom of the range was about a 50% retracement from the top of the range. Only, in the thirties, the top of the range was half its best prior bull market values.
In other words, to translate that into what it means today, if we argued for a seventies style economic model in our current outlook, as opposed to the earlier one where a gold standard was involved up until 1933, we might hastily conclude the Dow would trade between about 6000 and 12000 for the next 15 years or so.
Since we're further away from 12000 today than 6000, this increasingly becomes the bullish argument, or so it seems by the flocking of bulls to this camp where the outlook for a sideways trading range is simply a lowering of long term bullish expectations, an understandable psychological phenomenon at this stage of the bear. This way they may figure that a long term approach is still more sound, if only because of the semi-bullish risk-reward appearance of an arbitrarily chosen 6000 point range (from here the downside would be 2400 points and the upside would be 3600 points... yee hah).
It's nice to see the bulls lower their long-term expectations a wee, but let's give them a few more things to consider.
First, before we go on it may be noteworthy to mention we've argued for a seventies style inflationary environment for some time and still do. However, I'd like to think our arguments go beyond simply fitting the data so that the result is identical to that period's market outcomes, and thus convenient to our arguments.
At any rate, as you can see in the chart, the 15-year period after 1966 is marked by several bear market legs; each was worse than the other at least until the 1974 bottom.
Although the 1974 bottom proved to be the Dow's ultimate secular bottom, the time between 1975 and 1982 wasn't rewarding for the bulls that stuck to the tech stocks, or the nifty fifty issues. That breed was decimated, and in light of the extent of the dollar devaluation during the period, even the bulls buying gold and oil stocks after 1975 were having difficulty beating the inflation.
Nonetheless, gold and oil stocks dominated the latter half of the long 15-year stretch, and if that weren't the case, it would be hard to argue the market could have held its 1974 bottom.
Yet those are the kinds of inflations less developed economies such as Brazil like to practice, where the currency devaluation becomes impetus to a gain in real prices, and thus, a different character of nominal profits than when inflation policy is aimed at maximizing the value (or purchasing power) of the currency.
The point is that the "sideways" market during the seventies appears a lot less injurious on the chart than was probably the case, and it appears so because stocks were priced in devaluing dollars, which isn't accounted for in the chart. Against Gold and the CRB, for instance, the dollar fell 70% and 40% respectively from 1975 to 1981, while the Dow gained 66%. So at the end of that period, the Dow bought less real things than it did in 1974/75 where on the chart it made a price bottom.
Therefore, using the risk-reward argument as a reason for staying bullish on the stock market for the long run may prove a costly mistake, particularly if by staying bullish that means owning a stake in the currently broader conceptual strata of the economy.
Let me put it this way. The investors that bought a mutual fund in 1966 were no more likely to have broken even by 1982 than slick Willy could turn down a good cigar.
Bond Traders Have Yet to Factor Dollar
Devaluation
What's more, the seventies model only applies at all if the analyst's
outlook includes scope for enormous dollar devaluation, and continuing
inflation policies by the Federal Reserve System.
We'll contend that the so called sideways manifestation of values in the major stock market averages from 1966 - 1981 wouldn't have been possible at all without those factors, and indeed, the prior experience of the thirties suggests it wasn't.
But there's also another really important point to make here. Interest rates haven't been as low in the United States as they are today since the early sixties.
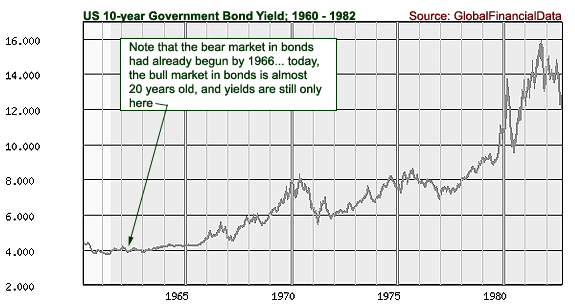
In fact, somewhere in the sixties the bond markets began a primary bear market. By 1966, yields on the 10-year bond rose to 6%, and then 8% by 1970. From 1970 to 1975 they fluctuated between about six and eight percent. Today, yields have yet to rise.
Why is this important to our outlook today? Because it's some evidence that by the time the 1975 bottom in the Dow came around, the US dollar had already undergone a significant devaluation (75% relative to gold and 50% to the CRB) and so had bond prices.
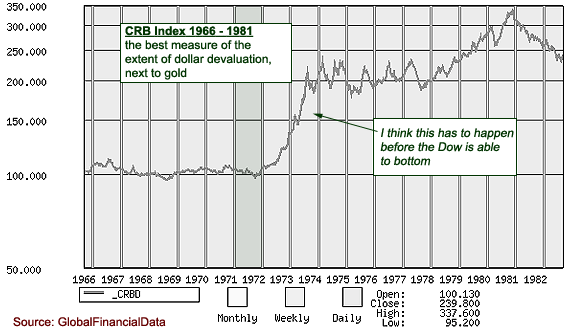
Note that the bottom in the Dow during 1974 coincided with a plateau in the dollar, commodity values as well as yields. Since we know bubble markets are better at factoring the past than the future, and these variables began to plateau, we can conclude that stock values reflected the prior movements. In other words, the variables had already impacted on stock values.
Thus, the Dow's value factored those events. We know that because those events are recorded and preceded the 74 bottom. We won't really know where the bottom is today until years from now when it becomes academic, but we're speculating that it can't come until investors factor these problems for the dollar. The alternative is to apply a different model. Perhaps Greenspan's productivity model would fit nicely.
But if we want to apply the seventies model to our current economic outlook in order to determine a comparable bottom value for the Dow today, I think first we need to determine a reasonable valuation for the Dow assuming yields would rise at least to 6%, and the dollar will devalue at least by another 30% relative to the CRB. Those are the conditions that preceded the 1974 selling climax after all.
So is Dow 6000 fair value if bond yields were at such levels, and if the dollar was in decline as it was during the period 1971 to 1974?
The main answer to that question depends on what happens to the dollar next. Is it going to fall precipitously so we can confirm the application of the seventies model, or is it going to rise so that we can finally be proven wrong about the whole darn thing?
Since our outlook for the dollar is bearish, our outlook for the next ten years or so indeed does mirror the period between 1970 and 1980 which is also marked by a meaningful devaluation in the dollar. To make the comparison between then and now without including what happened to the US dollar is erroneous, since it was the main economic problem of the day.
So if we're going to see a seventies style inflation and dollar devaluation then today's dollar weakening is only the beginning, and markets have yet to factor appropriate equity valuations. Can you see where we're going with this?
It Could Be 1971
My guess, if we were to try and superimpose the current period onto the
seventies era in most markets, is we are at about 1971. By 1971, the Dow
was rallying off a second bear market bottom, made the prior year,
and the dollar was beginning to come apart. Commodity prices just
began to turn up by the end of the year, and interest rates bottomed
after falling in sympathy with the prior year's Dow slide that ended 40%
off its prior high.
The main difference between then and now, at least in these particular markets, was that interest rates (10-year yields) bottomed at a higher level (6%), when today they are still at 4%. The bull market in bonds ended before the 1966 stock market top.
We consider it proof that bond markets haven't considered dollar devaluation yet today. And so, stock market valuations are probably due for further setbacks until at least market participants adjust their outlooks more in line with the reality of current circumstances, whose inflationary chalk marks are already all over the tape.
Of course, reality is something the Fed is able to change while it's still able to lower interest rates.
I suppose we could discuss the various reasons that enabled the Fed to sustain a low interest rate policy since the summer of '01 in the face of the inflationary factors we routinely discuss as becoming increasingly evident. However, I think we'd agree that 9-11 allowed further cuts that may not have been executed as effectively without a so-called "gentlemen's agreement" in favor of the dollar that lasted all about six months.
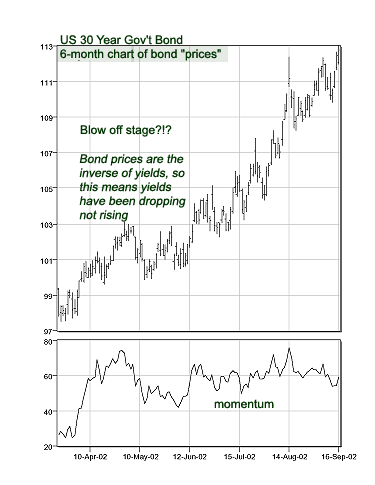
I only use such an improvable concept to explain a short-term phenomenon, and in hindsight, since the dollar first peaked during July 2001, and went off to lower lows in 2002, perhaps it is a relatively correct diagnosis of the interceding rally. However, the decline in bond yields since the beginning of the second quarter (2002) is harder to explain.
 During
2002, commodity prices have risen sharply; at a faster pace than at any
time since 1983 reportedly. This has continued right into September, and
its pace has picked up since summer.
Although the Fed slashed the Fed Funds rate significantly in the third quarter of 2001, the decline in bond yields since April 2002 has been steeper than their decline immediately after the 9-11 Fed rate cuts. This latter steep decline in yield coincided with a 2000-point drop in the Dow from April to July, so it's somewhat explainable; and it coincides with a heightened sense of anxiety about the war on terror, so it's further explainable.
But this all meets with a 20% gain in the CRB, a 10% decline in the US dollar index, and a boom in both housing as well as the profitless boom in consumption. Oops, did we forget to mention a deteriorating government budget.
It looks like we may have a little bond bubble on our hands!
Theoretically, the Fed must be hoping its inflation is feeding through enough to boost specific prices so that when interest rates inevitably reverse course, profits will be seen to be rising too.
So the third quarter is important for the bulls in determining whether they'll have the legs to run the Dow up on a commodity bull run. Or in other words, it's important for them to determine whether the inflation has seeped through to profits yet. So far the news hasn't been good, but that's typical since it's still profit warning season.
Whether the earnings are nominal or not wouldn't matter to the mass of investors who think inflation is the rate of change in the CPI.
The question is whether they are seeping through to the right prices, as opposed to squeezing margins. The evidence has been suggesting the latter, so if the bubble in bond prices implodes, because of rising prices of course, and even as margins erode, there'll be more trouble in paper paradise for the Tom Galvin's of the world to explain away, at what are still historically high stock market valuations.
The 1974 Bottom Is A Long Way Off
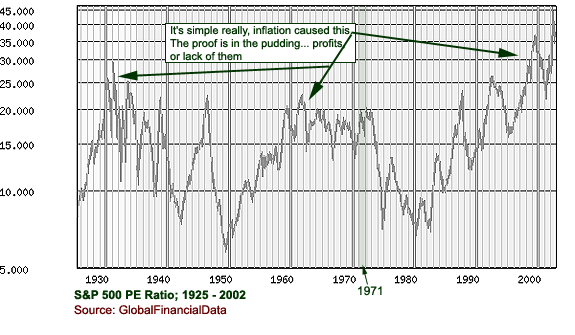
When interest rates were last as low as they are today (1960's), the S&P 500 traded at a trailing PE ratio of between 15 and 20 times earnings as you can see on the above graph. Today the S&P trades at 34 times earnings and the Dow we estimate at about 23 times trailing earnings - the only kind that are historically reliable by the way. Of course the spike after 2001 was due to a collapse in profits, but that's precisely the point. Profits haven't fallen as fast as they have in this cycle for about 50 years. Besides, the PE ratio made new records during the expansion phase right up until 2000, while earnings were apparently rising.
The excess was obviously greater in the latest cycle if we're correct about productivity and inflation. But that's not really the point. The main point is understanding the psychology of the transition from high multiples to low multiples. We argue that because the inflation increasingly manifested in real values, it became harder to fool investors. In other words, it became easier for them to discern the difference between real and nominal profits, and since they were increasingly perceived to be nominal, earnings multiples declined.
The bottom in valuations during the latter half of the seventies thus represented a deteriorated outlook, and consequently, a decline in expectations for stock returns. Nobody cared about forward earnings we can assure you.
The equity risk premium skyrocketed so that by 1974, earning yields for the S&P exceeded the 10-year bond yield by almost 50% (dividends excluded). In 1971, for comparison, this premium was actually a slight discount, as earnings yields averaged a little better than 5% while bond yields averaged a little better than 6%.
If we were to include dividends on the S&P 500 in our calculation, in 1971 stocks offered about a 9% yield (50% premium) and in 1974 they offered a 14% (combined earnings and dividend) yield, which represented a 100% premium to the 7 percent 10-year government bond yield during the same year (1974).
So the equity risk premium, calculated this way, doubled from 50% to 100% during the period from 1971 to 1974 - the stock market's ultimate bottom in the 15-year period under review.
Today, using a 23 multiple for the Dow (derived by the average current trailing PE ratios of the 27 Dow components that have recorded a positive profit at the time of writing) instead of the astronomical one in the S&P 500, the combined profits and dividend yield works out to be about 6% at current values (4% for the S&P 500).
This works out to a 50% premium over the 10-year US government bond yield today (no premium if we use the S&P 500 figures). If we're heading towards the bottom end of a long-term sideways range, similar to the one in 1974, this risk premium could double in a transition period that resulted in lowered expectations for stock returns.
So what value would the Dow trade at if bond yields rose to the 6%-8% range (in order to factor in the conspicuously accelerating inflationary variables), and the equity risk premium rose to 100% over those levels? Earnings yields plus dividend yields would have to rise to somewhere in the neighborhood of 12 to 16 percent, in order to validate a 1974 type model that would result in similar valuation outcomes. That's more than double today's stock yields.
It would put the Dow at between 3000 and 4000, assuming profits neither grew nor declined materially from current levels (200 to 300 for the S&P 500). This is well below our intermediate outlook, which calls for Dow 6000 this year; it is below Bill Gross' longer term outlook for Dow 5000; it meets David Tice's ultimate target for Dow 3000; and it approaches my partner's Dow 2000 target. It could very well take another few years to define this extreme a contraction in market confidence, but maybe not. The divergence between interest rates and reality is a factor that could reverse sharply, and accelerate the prognosis.
In any case, while the least of the bullish forecasts now call for a long-term bottom at 6000, that is our medium term target (by yearend, maybe even by October).
As we near that point we'll evaluate the extent of any serious bear market rally, but not until then, for lots can and probably will still change.
Dollar Bulls Attempt Comeback on Yen Pessimism
 So
our outlook thus remains bullish for gold in the medium and long term.
As for the short term, this week gold bulls have to contend with a recovery
in the dollar against the yen we're sorry to have to tell you.
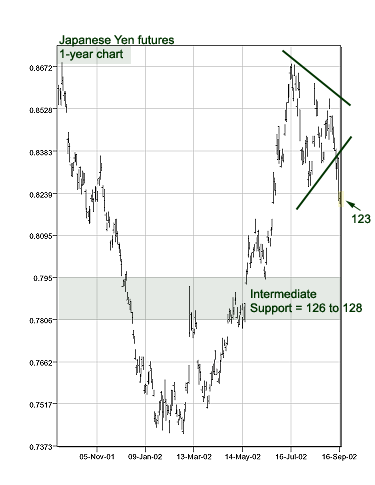
The story here seems to be renewed pressure by Japanese-US politicians on the BOJ to endorse yen devaluation as the means to stimulating the Japanese economy.
Every once in a while this pressure emerges, usually when the dollar is weak. Each time it does, it does so near a Bank of Japan monetary policy meeting, as is the case this week.
But outside of reducing interest rates, the bank has been loath to endorse direct yen intervention. This of course is sound policy, but since it is a central bank, which is a political tool, sooner or later if it is satisfied the public believes it is independent, it'll probably give in to the reformist pressures in government and allow prices to rise even if through currency devaluation.
I don't really think it could work since the imbalances are piled up on the US dollar's side, but if it did, it would have to be bullish for the Nikkei, which it could only if the stronger dollar stimulated US import demand, which meant stocks couldn't really go down as much as we expect in the US. Otherwise, a weak yen would only spur more gold demand from an already leery Japanese investment community. That said, a strong dollar could help the Fed sustain an accomodative rate policy.
The pessimism about Japan's economy, however, is a red herring for the yen because Japanese assets are still underweight in most international portfolios and besides, the bad market news largely emanates from the United States these days.
But if it were possible for US-Japanese authorities to sustain a cheap yen and a strong dollar, while simultaneously boosting equity values, the gold trade would have to key off of the trade in commodities, generally. If inflation continues to be the solution, which policymakers prefer to employ, commodity and gold values could easily still rise even while the dollar does.
The exception is if the policies are so successful they engender another paper bubble powerful enough a force in the dollar's favor that commodity values actually decline as they did during the late nineties.
Anything is possible of course, but if we're right about the similarities between today and 1971, as well as our assessment for the dollar in general, then we're only at the beginning of a large move in gold that may eventually fuel a recovery in the US stock market averages as that sector's inflation ultimately seeps into overall market capitalizations.
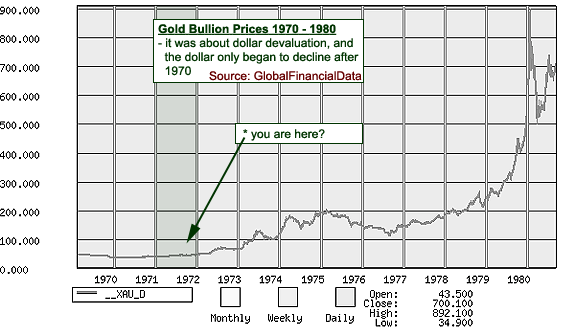
But we're so far away from that point, it's still exciting to think about!