Weekly Gold Markets
USd POG / FC POG Drives FX
22 February 2005
A gold & currency digest
By Ed Bugos
| Print Copy | ||
| Today's Highlights: | ||
| The Greenspan Effect (past tense) |  |
|
| Market Recap: bulls sweep Brown hijacking under the rug | ||
| Technical analysis of gold / gold share markets, budget baloney, trade deficit | ||
| What gold bull markets are all about | ||
| How gold markets work in relation to foreign exchange rates | ||
| Yen / SF prove better reserve currencies than USd or Euro in long run | ||
| Significance of weak foreign currency price of gold | ||
| Monetary facts suggest that gold undervalued; real gains in FX values short-lived | ||
| What about suppression scheme | ||
| Conclusions and Outlook Matrix | ||
From the perspective of being bullish on gold prices it is a concern that the foreign exchange value of the US dollar is falling faster than its gold value, and accordingly that the foreign currency price of gold has been weak. The reason is, gold cycles tend to start and finish with the foreign currency price of gold.
| "…if the variations in the objective exchange value of the money occurred uniformly and simultaneously throughout the whole community then such social consequences could not appear at all. The fact that these variations always occur one after another is the sole reason for their remarkable economic effects" - Mises, Theory of Money and Credit II.12.39 |
I really apologize for being away unexpectedly. I was trying to solve for the meaning of certain divergences – between exchange rates and gold values – and wanted to publish something fresh for you to chew on. In terms of research, my feeling is that if there is something unclear to me it might be unclear to our readers and I won’t let it go unless I’m satisfied in the substance of my findings, their relevance, and that they are presented as clear as possible.
This report took more than the average time to complete which I did not anticipate when I started it; but I believe we are at a critical inflection point for the gold story right now, and so I hope the extra time it took to reflect on these things turns out to be worthwhile. Our subject of study this past two weeks was the relationship between money supplies and foreign exchange rates; foreign exchange rates and gold values; the structure and way that changes in real currency values affect the monetary system; and the usual contrasting of various conventional arguments with actual economic principles (it takes a lot of work to be right!?). However, before I reveal my observations, conclusions and hypotheses, and how they affect our gold and dollar outlooks, I want to summarize the Greenspan effect in terms of the 1990’s – it is also relevant to the later discussions of what happened and is still happening to the real value of money.
Greenspan deserves credit for the late nineties boom. Not in the sense it is in recent years – for printing himself out of trouble – but for the opposite.
The Greenspan Effect
Volcker (the prior Fed Chairman) is commonly awarded credit for establishing
the disinflation of the eighties – perhaps it is warranted; if I
were to concur I would not be referring to prices, but to trends in money
supplies (inflation in the true sense) that determine changes in prices.
And this change indeed began in his time.
But it only just began, and only in the broader money categories (see chart below).
Conventional wisdom has it that money supply didn’t matter, conveniently; only the fact that he was willing to crank interest rates up to the double digits is attributed credit, and that only because prices stopped rising so fast in the eighties (though they didn’t quite fall). So it is thought that this was what ended the US dollar’s rout.
To emphasize, the relationship everyone sees is interest rates affect currency values which in turn affect real (gold) values. The concept of money supply has left the building. The reason it is convenient of course is simply because that’s exactly what the Friedman-monetarists claim, that money supply means nothing…
…Except when they want to stabilize prices!!
But the fact is, as this report will show, money supplies did and still do matter.
One of the grandest delusions of the past 20 years is that interest rates determine, or cause price trends! Interest rates set by the central bank mainly determine the demand for credit, which is essentially how it controls money supplies – by manipulating your time preference rate (the way you value current goods relative to future goods).
But it is a mistake to think that by lowering interest rates in 2001 the Fed implemented a weak dollar policy and deliberately boosted prices in order to help the economy recover.
Money supplies are responsible for that con job… interest rates only contributed to the extent they affected money supplies and other variables.
To the extent that a rise in real interest rates is likely to encourage savings at the expense of consumption, and to weigh on credit inflation, it could affect increases in the real value of money; but this is not necessarily true of fiat type monetary regimes.
We’ve seen interest rate spirals in many countries have absolutely no effect on the real value of its money – usually because the market was in the midst of rejecting it as money. Insofar as Volcker affected such a strategy successfully he deserves credit at least for temporarily stabilizing the value of money, and reigning in some of the inflationary excess. However, it could also be argued that he had help from developments that were already under way – that the bear market in the foreign exchange value of the US dollar was already ending, and commodity prices peaked due to overcapacity (malinvestments). Regardless, taken together these facts contributed greatly to the emergence of disinflation trends in the early eighties.
But, it was Greenspan that delivered true disinflation (as true as it gets) and came close to saving the greenback after it began to reel again in 1985… if only it weren’t for an abrupt change in policy sometime after 1996/97. Whatever happened to inspire it, today’s Fed is nowhere near the Volcker ideal and the cost of going back to those days is going to be great… greatest for US stock and bond holders.
Stock and bond values 10 years ago might have been supported by fundamentals but today they are sitting on an inflationary precipice.
…That means hot air, baby.
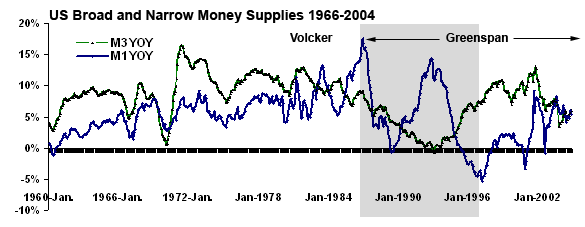
The shaded region in the chart above effectively reveals Greenspan’s strategy. It was exactly this strategy that stabilized the real (gold) value of the US dollar, and set the economy up for the real growth that was to follow.
Remember that in our economic model (Austrian filtered) the less inflation (and other intervention) the better the economy performs. Under Greenspan, the growth in broad money (M3) supplies steadily fell until about 1993, making it the strongest true disinflation since the short period 1968-70. As a result, in the seven year period 1987-1993, M3 grew only US$755 billion, or 21% overall; contrast that with the subsequent seven year period 1994-2000 (especially post 1997), for instance, where M3 grew by almost US$3 Trillion, or 66 percent. In the period after the 1987 stock market crash the US economy didn’t seem to be doing that well. But in fact it was healing; malinvestments were liquidated in the financial sector and the productive factors were lining up; prices were mostly well behaved and interest rates were mostly falling; and Clinton seemed to be reigning in the budget, or at least getting the budget back on track was the voting public’s top priority in the early nineties. The economic boom that came after 1995 arose due to these facts, resulting from the disinflationary Fed.
In fact, Greenspan even hinted at that in one of his occasional credit taking speeches.
There was of course the effect of the IT revolution. This was real and probably helped mitigate and even hide the effects of much of the inflation in broad money that occurred later in the nineties. Thus the 66% expansion in M3 over the next few years undoubtedly helped fuel the escalation in stock values that convention attributed to irrational exuberance (speculation!). Yet, the real (gold) value of the US dollar, and of many other currencies, rose in the period between 1995 and 2000.
How could this be if the disinflation had turned back into inflation?
The real answer is that the value of money is determined subjectively, by us, and our frame of reference is our memory – of past trends… there is a well known lag between the inflation in money supplies and the full extent of the change in the value of money. The Fed admits to it candidly, but with a positivist spin – i.e. that there is a lag between the stimulus (inflation) and its effects (economic growth).
The conventional explanation for gold’s collapse in the latter nineties (since interest rates were going down), was the deflation angle – that the collapse in the Russian and Asian (tiger) economies caused a collapse in final (aggregate) demand that spilled over into commodity prices; the US economy became the Island of Prosperity and the USd shot up at gold’s expense. Of course, gold demand didn’t fall.
Certain economies collapsed due to the weight of their own inflationary policies and some currencies lost their monetary value nearly altogether (Russian Ruble), which increased the demand for both gold and the other currencies. The US dollar was ideal relative to gold for the reason that the prospect for real returns in dollars still appeared high (thanks to the Volcker/Greenspan effect on the economy).
The period from 1995-2000 (inclusive) was the most stable period for US M1 since the late fifties (see blue line in graph above). During that six year period M1 actually declined by US$50 billion. This was a significantly bullish policy with respect to the US dollar’s gold value at the time.
Thus the dollar’s foreign currency value was bolstered by the currency crises overseas, the relatively strong US economy (thanks to prior and relative disinflation trends), strong relative financial returns (exacerbated by M3 reflation but also due to productivity gains), and the effects on its real (gold) value stemming from the Fed’s policy with respect to M1, which was to be abandoned in 2001 in response to the financial bust that ensued.
…all because they wanted to spike the punch just a little, at first.
The important point is that the positive trends in productivity, interest rates, and in the real value of the US dollar were the consequence of a concerted policy by the Greenspan Fed to extend the Volcker legacy of disinflation well into the nineties.
Indeed, the Greenspan Fed went further down this road than Volker did, at least until 1997 when “liquidity” injections became the status quo policy response to cracks in the stock market, and the Fed resorted increasingly to inflation in order to keep it going.
After that it became a matter of biding time… patching holes and preventing the calamity. In the face of the magnitude of increased inflation and financial speculation the rational for the offloading of central bank gold drew suspicion from the sound money corners, and round about the time that the Bank of England announced it was throwing in the towel on gold in 1999 – when gold was just breaking out – organizations like GATA sprang from one of those darker corridors. Thus it was that at the turn of the millennium, the Volcker/Greenspan Fed became the McTeer/Bernanke Fed.
Whereas the nineties boom (including the new economy optimism) arose from an environment of resolute disinflation (the Goldilocks story), the current post-2000 boom (recovery?) is a postponement of the necessary liquidations of malinvestments accumulated during the later nineties and otherwise inspired by completely opposite fundamentals – intervention (artificial stimulus) instead of real.
We are a long way from a repeat of the late nineties.
What we’re seeing now is an illusion, a distraction. The bullish Volker/Greenspan effect on productivity and real currency values has long gone. Monetary policies everywhere have reverted back to their normal inflationary agendas and the bullish benefits of the Greenspan experiment (1987-1997) have been lost on everyone – fortunately for gold bulls because it was just that which explained the US$200 drop in gold prices during the period. The current gold cycle was born in the years following 1997 as bubble economics abruptly and increasingly supplanted sounder economic policy. At any rate, it might make sense to come back and re-read the above conclusion after the report.
Market Recap: Gold Bulls Sweep
Brown Hijacking Under the Carpet
The gold shares have made a strong comeback over the past two weeks.
In the past ten trading sessions the gold share averages are up almost 10 percent – most of it occurring in the last half of the week before last though.
Last week was a matter of holding those gains, and they did that well too. The HUI was up ½ percent while the XAU was up 1.5% and the TSE gold sector was up about 1% in the five days ending Friday. Next to the diversified mining company index, the gold share bourses have topped the list of S&P sector performers over the past two weeks; falling behind only the software services sector in the prior week.
Last week the steels and oil shares topped the list however. Within the stock market the sectors providing the most bullish technical support to the averages continue to be the commodity-related stocks, builders, railroads, steels, energy shares, and real estate.
The drug sector looks to be making a comeback, and gold shares…
Bearish comments by Greenspan in his Testimony to Congress last week about Fannie Mae and Freddie Mac (there is “no reasonable basis” that their portfolios should be as large) sent the financial sector reeling.

No doubt the strong PPI contributed to that rout. The US PPI grew 0.3% in January which was only marginally better than expected; but the market focused on the so-called core figure: “Producer prices excluding food and energy rose 0.8 percent in January, above economists' forecasts for a core reading up 0.2 percent. That was the biggest jump in core prices in six years. The headline producer price index rose 0.3 percent, compared with economists' forecasts for a rise of 0.2 percent” – Reuters
Normally the markets would have braced for a hawkish theme but the FOMC’s inertia and comments by a Fed member after the news extinguished those fears promptly and kept the USd under pressure instead. Besides the financials there is some technical erosion evident in the retail sector, the techs (the NASDAQ chart looks wobbly), airlines, and the utilities and transports are showing some wear as well. The broader averages (Dow, NYSE, and S&P 500) have mozied back on up to their highs but on narrower breadth. Volumes are above the 200-day average but the bullish spikes that accompany the New Year are absent this year so far. Those markets seem to be caught in a drift of sorts.
The fresh bullish prints of a recovery in commodity markets, returning dollar weakness, and the downturn in the bond markets are a bearish combination for stock market PE ratios in general. Indeed, over the past couple of weeks gold has outperformed most paper (stocks and bonds), as well as platinum… though it is still underperforming the base metals (silver and copper), energy, and the grains now.
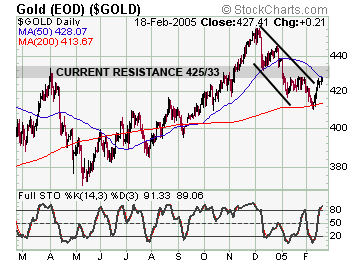 Gold
prices were up $6 last week after being up $6 the week before (they are
up an additional US$3 overnight Monday – President’s Day),
which has been causing new trouble for the USd (FX). The
current gold rally must be threatening to the bears since the market’s
structure is so cleansed of bulls – thanks to Messrs. Brown, Greenspan
(Sir), and the rest of the gang at the IMF and BIS roster. The
green light, technically, is a break back up through and out of the US$425-433
range.
Last week’s rally stopped just over $425 and this morning’s pop touched the top end of the range of resistance (US$432). The move up through US$425 Friday and the follow through Monday morning is bullish short term because it marks the last lowest high in the two month correction sequence which we see as a typical flag – and a typical 3 wave sequence.
I correctly anticipated the timing of the correction but not its duration.
Nonetheless, a break through US$433 should be the green light that preps the market for the big move through $500 we’ve been waiting on, though which hypothesis is still close to being ruled out if it doesn’t happen soon… it looks to be in progress.
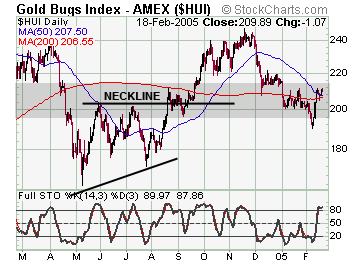 For
the HUI the important reversal point is also a range: 214-221. Gold
is on a roll – it is up nine days in a row now
(including Tuesday morning). But the gold shares are trading even better.
The four day rally in both gold and the shares to last Monday was the best one since August when the bulls first broke out of a 3-month (Jun-Aug) ascending triangle formation (albeit a tricky one) to end the correction that began at the beginning of 2004.
What’s more, although we use the HUI for a technical proxy, the other bourses (TSE and XAU) and many of the individual components have more clearly taken out the last lowest high in the two month correction sequence. More than half of the sector is above its 200-day moving average now. The current rally in the HUI looks like a belated bounce off the neckline of the triangle (see chart) after a full retracing, as well as a moving average crossover if you allow some room for volatility since the HUI actually fell through both the moving average and the neckline; the moving average is almost exactly at where the neckline is.
The exact reversal point for the two month correction in the HUI is 211 but I would extend that to 221 – if we get through there the next 50 points is a walk in the park!?!
Nevertheless, the rally is occurring next to a bounce in gold prices off their primary trend line (and coincidentally the 200-day moving average).
So, Gold and the HUI may have completed a three-wave sequence down – from the November high – within what appears to be a normal corrective pattern (flag). Our intermediate target for the HUI remains at 265 on a gold rally through US$500.
The trader that is holding cash right now and looking for a 20 percent move in something would be wise to look for a breach of $433 in gold and/or 221 in the HUI in order to signal a timely long trade (or short if you’re a cynic about T.A.) if we didn’t persuade them two weeks ago.
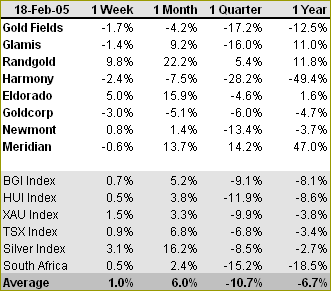 The
best performing gold & silver stocks in the PM indexes last week were
Randgold, Agnico Eagle, Eldorado, Barrick, and the silver shares on a
surge in silver prices – up from five to ten percent (the previous
week it was DRDgold, Silver Standard, Meridian, Coeur d’Alene, IAMgold,
and Eldorado respectively… all of which were up from 12 to 20 percent).
Goldcorp, Agnico Eagle, BVN, Cambior, Wheaton and Newmont dragged the bottom of the list both weeks. Goldcorp is down about 4% in the past two weeks probably as the result of full valuation at these gold price levels.
We’re looking for an opportunity to take profits in this stock on the next good rally. I’m pleased with the rebound in Eldorado’s and Glamis’s share prices; and even more so with Meridian’s ongoing leadership in the sector. I am also pleased with Randgold’s recent comeback. I don’t have a tradable insight on the Goldcorp, Glamis, and Wheaton merger – the markets have probably already factored in the takeover premiums into Goldcorp and Wheaton shares; and Glamis probably recovered because its bid failed (they let it expire).
I don’t know if they plan to make another go of it but I hope not; it’s clear the market wasn’t enthusiastic about Glamis overpaying for Goldcorp. I’m not optimistic that Harmony will get Gold Fields but we’ll have to let that play out.
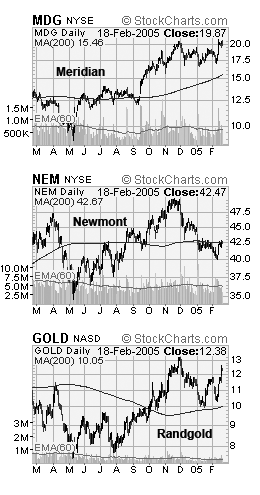 In
terms of performance Meridian has ranked in the top 10% of the sector
consistently since November’s rally, and just about consistently
since May 2004. The Randgold Resources (GOLD) chart looks ripe for a continuation
of the bullish move that got underway in the last quarter of 2004 –
the break out point is US$12 and we’re looking for this stock to
outperform the sector.
We wouldn’t chase Meridian up here however.
The conservative buys remain the South Africans; the more aggressive buys that I still like at these levels are Randgold and Glamis.
Newmont is probably suffering from the bad and quite probably unwarranted publicity over the environmental issues at mines in Peru, Turkey, and Indonesia; the recent rock slide at the mine dump near Carlin (under investigation) probably doesn’t help. However, it could also be that we’re at a point in the cycle where the small to mid cap producers get the market’s spotlight.
Gold Fields and Harmony continue to lag the sector but could be putting in significant long term bottoms right now. Eldorado broke out nicely this week. Placer is also lagging the bullish trends, as well as Kinross and Golden Star (as well as Goldcorp now). Generally from a bottom up perspective most of the gold shares are confirming the break out scenario.
The US dollar index finished flat the prior week and down a bit last week. The big currencies (Yen, Euro, and Swiss Franc) are either lagging or matching the dollar’s moves but strong gains were made in the Australian, Canadian, and British currencies.
The bullish recovery is a welcome surprise, for as we wrote in previous issues, the window for the blow-off scenario was shutting down and we were losing hope that it would occur during the first half 2005.
However, now we’d like to see some resilience and follow through.
Two weeks ago Greenspan predicted that an end to the worsening trade gap was at hand; the UK’s Gordon Brown’s turned up the heat on an IMF gold “sales” plan; and the USd was coming on strong in sympathy with a post-FOMC relief rally in stock and bond values. But that all came to an end beginning with the release of a disappointing GDP figure in the week before last, and Bush’s budget for the current fiscal year and beyond.
The budget foreplay in the weeks leading to the news turned out to be more exciting than the fact. The OMB projected that the budget deficit would fall to $427 billion in the current fiscal year, $390 billion in 2006, and to $250 billion by 2008.
The Democrats revealed it as a farce for excluding a lot of things (including homeland security) and for underestimating future Iraq expenditures. But clearly, even if those charges were but a matter of partisan squabbling, the OMB’s projections still factor in a very rosy tax revenue picture. The interesting thing was that the revenue projections weren’t disclosed in most press reports, and the figure for total expenditures this year ($2.57 Trillion) was bandied about without actual reference to total outlays in preceding years – even the White House’s own press release was evasive about it. I had to go to the Treasury’s monthly treasury statement in order to find out that that figure ($2.57 Trillion) actually represents a $250 billion increase in expenditures (total outlays) over the fiscal year ended September 2004, and that therefore in order to get those rosy deficit projections there must be a generous revenue assumption… the stock market better not decline! The fact that I had to go directly to the horse’s mouth (or further) in order to find the hard data is disconcerting because it suggests that the press merely reports whatever the government sends it – no questions asked.
But, this you all know is the state of affairs anyway. It may be sad that the state paints the proposal as a CUT in anything; but it is sadder if anyone believes it.
Notwithstanding, we felt that the markets saw right through the fluff; that it was only a minor decline in a deficit spread through the decade, even though it only took a couple of years to create. Combined with the projected increase in the total level of the national debt from $8 Trillion to $11 Trillion by 2010 it hardly qualifies as an improvement even before questioning the optimistic character of the forecasts.
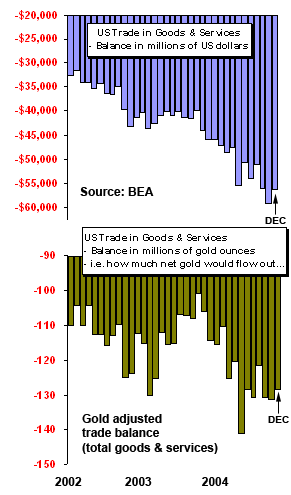 Late
in the prior week US trade figures were released for the month of December
also revealing a minor improvement; but nothing that could vindicate Greenspan’s
forecast, yet. The balance of trade in goods and services shrank US$3
billion (5%) in USd terms during December from a revised record US$59.3
billion in November; the year over year increase for the month
of December was 28 percent. For the entire year (2004) the trade gap widened
by 25% to a record US$618 billion compared with an 18% increase in the
prior year over 2002.
The graphs to the right put the significance of any improvements in December into proper perspective. Clearly this statistic is still generally worsening. The news pressured the USd. However, we note that in gold adjusted terms the low point for the deficit was June so far. And, based on our bullish outlook for gold prices, our bearish outlook for the foreign exchange value of the US dollar, and the implications of Sherlock Green-speak’s call on trade, we would expect the trade deficit to gradually improve. The only bearing that has on the value of the dollar is that as a pre-condition the USd must decline further on the foreign exchange markets. Else, a recession is necessary to make it happen.
With little substance so far to back either Greenspan’s bullish projections for a meaningful improvement in the trade gap or the government’s rosy forecasts for the US budget deficit, on the heels of disappointing 4th quarter GDP news, a timid FOMC inaction in the prior week, lackadaisical performance by the stock market in recent weeks as (nominal – money denominated) earnings basically come in where expected, a return of geopolitical tensions related to North Korea and Iran (and some in Iraq), early signs of failings in the Bush pitch on social security, as markets became persuaded that the US wouldn’t side with Brown on the IMF gold sales issue, and further, in the context of shaken out gold markets, the bearish gold arguments relented sharply last week.
Last week’s PPI news and the events surrounding the mortgage companies further bolster our case. For our part, we have always been skeptical of any bullish impetus to the dollar outlook from improvements in the budget and trade deficits, or in the stock and bond market outlook, or from FOMC rate hikes.
The American President is making the rounds this week apparently making up with old friends over the Iraq mishap; there is some speculation that if he fixes relationships the dollar will get a boost. Whatever.
On social security: it is probably factored, and it isn’t really privatization – just a government plan to involve the state in the business of investing… as if that wasn’t oxymoronic just to write. Bush will probably get his way. As far as stock markets go it is thus bearish if he fails, and maybe bullish for a week if it goes through.
Any increase in geopolitical (I hate that word too) tensions ought to be bullish for gold prices but these things are a distraction from the fact that if the dollar was sound to begin with gold wouldn’t go up on such garbage.
It doesn’t escape me that it is to the advantage of gold’s opponents that gold price rallies are allowed during an escalation in geopolitical tensions – it makes being bullish on gold look like a bet on doomsday-type news… a situation where the reward seems to go to speculators betting on violence and social crises rather than to those of us trying to protect ourselves against the consequences of untenable government policies.
It makes the world of fiat money look invincible were it not for the occasional unexpected exogenous political shock! Indeed, this misconception (that gold bull markets occur in times of political crises) is precisely how most of the market views historic gold bull markets, and why the public rarely sees one coming.
The irony is that political crises tend to follow on economic ones… when the artificial boom(s) turns bust and the state(s) turns increasingly to warfare (or more welfare – i.e. inflation and intervention, etc.). It is commonly overlooked how the political crises that manifested in the seventies era were related to the dissolution of the Bretton Woods agreement (the final attempt to demonetize gold in 1971), which occurred in the first place as a result of bad government policy (inflation and intervention in the post WWII era; 1945-68). The misconception is due to the official interpretation of the collapse of Bretton Woods – foreign governments (Britain and France) demanded their dollar promises be exchanged for gold reportedly due to public pressure in their own countries over the US policy towards Vietnam during the late sixties. The truth is that these demands came not long after the dissolution of the London Gold Pool which went defunct trying to suppress gold prices under the terms of Bretton Woods which required they be kept at US$35 an ounce. The pool found that was difficult to do in light of the extent of inflation that the Fed embarked upon in the 20-year period after WWII.
Foreign government demands for gold arose simply because they doubted the US government could cough it up. The deteriorating political environment was a natural consequence of affairs, and a convenient cover.
It is more than a surreal myth that when
the economy goes bust the state goes to war!
It’s happening right before our very eyes today… well, at
the moment they all think the economy is recovering. The trouble is that
the economy goes bust because of the state; then the state takes us to
war. The most important news this week will probably be the minutes from
the prior FOMC because they will probably reveal hawkish TALK.
The press likes to focus on the talk. The CPI is due out Wednesday (expected is about + 0.2%) followed by durable goods, inflation data from Canada, and BOP data from the Euro zone. The best bullish arguments for the USd remains the short term interest rate front with respect to European and Japanese carry trades – which we perceive to be minor in relation to other factors – as well as deriving from Brown’s rhetorical campaign against gold (we should be on guard at least until April’s IMF meeting).
What Gold Bull Markets Are About
They are about the erosion in the real value of money, period.
It is not a uniform process.
Let’s start with the fact that all of the “currencies” have lost value relative to real things such as real estate, gold, and the commodities, as well as against capital (stocks) over the long term. Furthermore, the extent of this loss is loosely correlated to the extent of the increase in money supplies. So within the G7, for instance, the most inflationary currencies over the past 30 years (Australian, Canadian, and Pound) have lost the most gold value (anywhere from 50 to 85 percent), while the least inflationary currency (Yen) has lost only 25% of its gold value in the same period since 1976 (see table). Likewise, even over the past 10 years this has held true.
The Bank of Japan has ramped up narrow money since 1995 at a faster clip than the rest and accordingly the yen has lost the most gold value in this period; while the Fed, recall, has been least inflationary in terms of M1 (even including the post-2000 period) and accordingly has lost least gold value within the G7 since 1995.
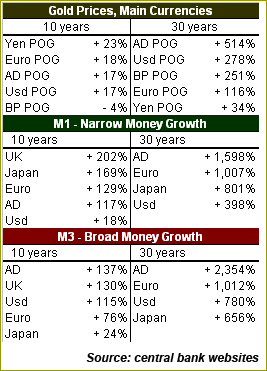 Moreover,
genuine marginal currencies like the Rand where M1 and M3 tend to grow
even faster have lost up to 98 percent of their values since 1976. Hence
there should be no question of the relationship between money supply growth
(relative to demand – inflation) and the loss in value for the currency
in question. The evidence goes beyond mere theoretical support.
Exchange rates between currencies aim to reflect not the absolute loss in real value of currencies, but rather their relative loss.
If, for instance, two currencies were to lose the same extent of real value their exchange rates would not change with respect to each other (beyond short term fluctuations).
By contrast, it is commonly thought that the strength in the foreign exchange value of currencies like the Rand and Canadian dollar today is the fundamental cause of the weak foreign currency price of gold. However, foreign exchange rates do not cause changes in the real value of money.
They only reflect and at most anticipate changes in the real value of the various monies (currencies) relative to the commonly traded goods. To the extent FX traders anticipate a change in real value in one currency before it actually occurs it creates an opportunity that merely speeds up the process. Incorrect anticipations don’t tend to last because they aren’t supported by real shifts in supply and demand.
It’s important to understand this in order to avoid the common traps, that gold and commodity price movements are a function of the trend in foreign exchange rates, which are based on relative economic variables (growth)!
You’ll rarely predict foreign exchange swings let alone commodity cycles properly with that theory. They’re hard enough to predict with a sound theory.
Still, the fact that all currencies drop in real (gold) value in proportion to their inflationary policies is usually explained via the conventional theoretical paradigm that strong economic growth (GDP) increases aggregate demand which increases prices – in which model higher prices for everything equals greater prosperity.
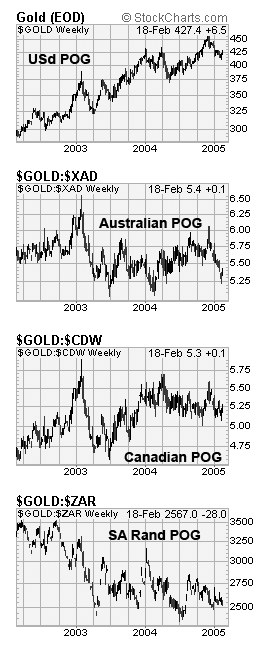
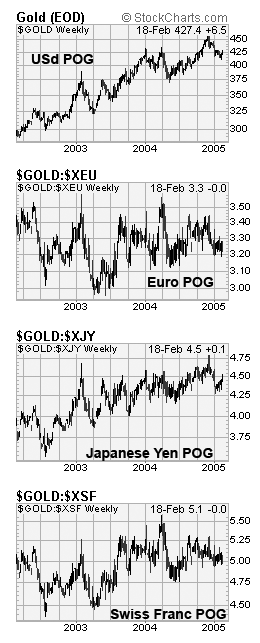
In such circumstances, gold would surely be the dependent variable… it would lag currency trends, not lead them. Indeed, when we look at the foreign currency price of gold through the ratios offered at Stockcharts.com it is in fact merely a function of the exchange rate. In other words, the ratio of the USd price of gold to the Australian dollar price of gold is exactly equal to the currency AD/USd in our charts, instead of just implying it. So we must keep that in mind when making conclusions.
Implicit in using these ratios as proxies for the actual foreign currency price of gold is the theoretical supposition that the exchange rate has already adjusted for the change in relative real values of the currencies – this is a fair assumption since gold is a very liquid internationally traded commodity with monetary value.
Nevertheless, it is correct to say that the exchange rate between two currencies is determined by the rate of change in gold prices of one relative to the rate of change in the gold price of the other, as opposed to saying that the rate of change in gold prices is determined by changes in foreign exchange rates. Thus the comment that the strong Rand is causing the Rand price of gold to suffer is incorrect; the correct inference is that the USd price of gold is rising faster than the Rand price of gold, and thus the arbitrage favors buying Rand for now. I believe this is important because the former presentation suggests nothing more than when the Rand weakens in relation to the US dollar that the Rand price of gold will go up and the USd price of gold will decline.
But that is not right.
Moreover, the analysis might center on the wrong data – we might be drawn to strong nominal gains in South African GDP or currency policy as explaining the reason for the strength in the Rand instead of monetary factors that might or might not justify the relative real gain in value for the currency, implied by a declining Rand POG.
Foreign exchange rates are determined by only one thing: the relative change in the real value of monies. It’s true that other things besides inflation affect this change in real (gold) values, like changes in real interest rates, political factors, and the allure of prospective real returns. However, all of them together are necessarily already imputed in the real value of the relevant money when the exchange rate between monies is determined in the market place. That’s why for instance the gold values of currencies in the table above are only loosely correlated to their respective inflation policies. As far as our analyses go, it’s just that inflation, currency policy, and productivity are the most significant factors affecting the real value of money.
But besides theory, there is also data that supports the supposition that changes in gold prices (assumed as a good proxy for changes in the real value of money) cause or lead changes in the foreign exchange rates.
How Gold Bull Markets Work
The correlation between inflation (surfeit money supply growth) and the
real (gold) value of the relevant currency suggests that the inflationary
currencies fall fastest in terms of gold. This
proposition is supported by the chart fact that the foreign currency price
of gold tends to lead the USd price of gold
(up and down) in more than 75 percent of instances in the primary and
intermediate sequences, which in turn also explains why the USd price
of gold bottoms BEFORE the foreign exchange value of the USd falls, and
vice versa, peaks before it bottoms. In
the examples that follow I use the Australian dollar as a good contrast
with the USd. Within the G10 I would consider the Australian currency
as a relatively marginal one, while the USd is still THE reserve currency.
This contrast is evident by the length of the lead/lag in the charts below.
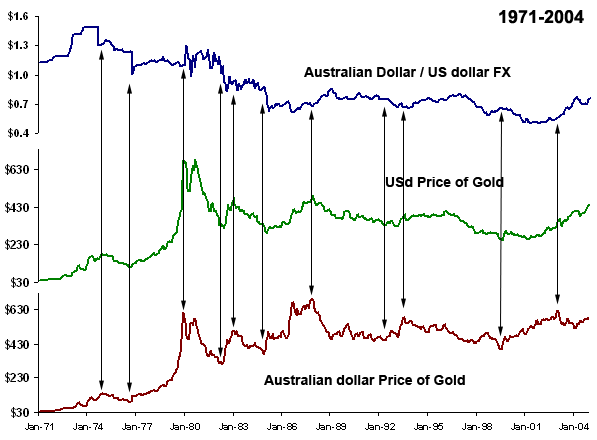
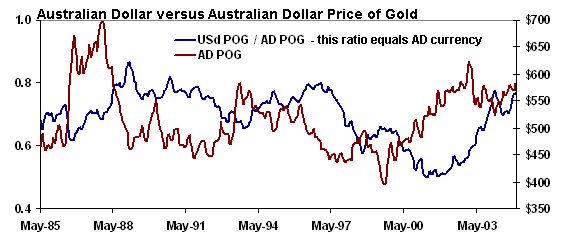
All of the arrows key off reversals in the Australian dollar POG (red line on bottom) and are straight up and down so that you can see for yourself that the ordinal sequence is as follows: AD POG, USd POG, AD/USd FX rate.
That is, the Australian dollar price of gold bottoms or peaks first, then the US dollar price of gold does, followed by the appropriate change in exchange rates (blue line).
Theoretically this shouldn’t be so noticeable because markets are supposed to be efficient enough to eliminate the opportunity in a matter of minutes.
There is an explanation if you accept that 1) the Australian dollar being marginal is losing real value faster (as suggested by the consistency of the lead-lag relationship above and other facts), 2) generally both currencies are losing value because this is an ongoing process (which is why trends exist), and 3) that nothing happens in markets until humans make them happen, and humans make them happen when an opportunity presents itself – the opportunity in aligning different markets to variations from one source is the domain of arbitrageurs.
As a rule, whether the gold price goes up or down in whatever currency, in terms of foreign exchange profits the arbitrage opportunity favors buying the foreign currency where gold prices are rising slower or last (or where they're falling faster or first) at the margin and selling the currency where they're rising faster (or falling slower).
This is why the exchange rate between two currencies mirrors the behavior of the ratio of gold prices in those currencies (and is equal to it mathematically)… arbitrage activity makes it so. But what explains the particular sequence above is that new variations, hence opportunity, continue to originate from the marginal currency so that it remains profitable to buy gold in USd’s and sell it for Australian currency, causing the foreign exchange rate of the US dollar to rise even as USd gold prices have begun to rise until they rise faster, at which point the foreign exchange arbitrage favors the Australian dollar (as it is right now) for as long as that lasts. But it is only because the erosion in real (gold) value begins with the marginal currency which explains why gold price trends so consistently lead changes in the foreign exchange value of the USd.
Since the arbitrage favors the currency where gold prices are rising slower (or falling faster), gold prices in that currency can rise (or fall) for some time – until they begin to rise or fall faster – before they affect a reversal in exchange rates.
In the chart below, for example, you can see how well changes in the Australian dollar POG forecast changes in the Aussie’s foreign exchange rate. Not. The relationship that I see here is that the red line tends to lead the blue line. What that would mean is that a fall in the real value of the Australian dollar predicts a rise in its foreign exchange rate against the US dollar. Yet that could only be so to the extent that the decline in the Aussie’s real (gold) value ultimately always results in a relatively faster decline in the real (gold) value of the USd, as though there were always a transfer… as though changes in the real value of the USd were not only dependent on the Fed’s inflationary policies but also to a lesser extent on those of its allied central bankers at the margin.
Thus so far we know that money falls in value in proportion to inflation rates, that the marginal money falls fastest, that it is an ongoing process, that exchange rates are determined by how fast monies fall in real (gold) value relative to one another, and that possibly it is difficult to isolate the US dollar from declines at the margin. Exactly just how that might work is a question I have not found a complete answer to.
But at any rate a picture should be emerging about the relationship between gold prices in various currencies. The theory that monetary erosion starts in the marginal currencies and ripples through the monetary complex is deduced a priori from the observation that the increase / decrease in USd gold prices LEADING a decline or appreciation (respectively) in the FX value of the USd is explained satisfactorily by the observable fact that the foreign currency price of gold tends to rise before (or faster than – same thing) the USd price of gold. To the extent that we could aggregate the monetary order under a US dollar hierarchy (which is not a big leap from the fact that it is the reserve currency) then: it is only as strong as its weakest link(s).
Thus, one important hypothesis could be that the more marginal a currency is the more likely its gold price is to lead a cycle that ripples through the currency complex – which we could use as a leading indicator of sorts.
Excluding the realm of obvious marginal currencies, and within the world of liquid G10 currencies, the South African Rand, Australian/Canadian dollars, and perhaps the Pound could be considered marginal because they have lost the most gold value.
The core currencies that have lost least gold value include the Swiss Franc, Yen, USd and Euro in roughly that order. The USd is the reserve currency because it is the one most widely owned by the central banking community and because of its wider international circulation in general. But over the long term, the reserve currency will be the one that loses least gold value – Gresham’s Law notwithstanding. Since 1971, the US dollar has fallen down the list on this basis relative to the Yen and Swiss Franc.
During the 1990’s, in fact, the USd gold price began to lead the Yen gold price as though it became the more marginal currency.
However, since 1999, the Yen POG has shot up 55% due to the Bank of Japan’s incessant meddling in foreign exchange markets (and the inflation required to sustain it).
Finally, our theory refutes the paradigm that explains higher commodity prices in terms of economic growth because that would imply that the (economic) growth cycle begins with the marginal economies!
Weakness in FC POG Related to the
“Everything is okay” Syndrome
To further strengthen our hypothesis, it is significant to note that divergences
in the trend between gold prices in the various currencies don’t
last long; in the case of the USd and AD price of gold they have rarely
lasted longer than one year.
| “…If any given kind of money is deprived of its monetary characteristics, then naturally it also loses the special value that depends on its use as a common medium of exchange, and only retains that value which depends upon its other employment. In the course of history this has always occurred when a good has been excluded from the constantly narrowing circle of common media of exchange” – Mises, TMoC II.8.97 (underlined is mine). |
For the rest of the time they traveled in the same direction – mostly up on net. It is not as if they go up in one currency, and when that currency reverses they go down on that currency proportionately. Moreover, when gold prices trend down in all currencies as they had often enough for those in the G7 during the 20 year period marking the end of the last millennium, those benefits flow right through to real growth and are usually driven by some sort of monetary restraint (good time to re-read the Greenspan effect now).
So in view of what we’ve established, the questions that need an answer are: Why is the foreign currency POG falling? Is it a matter of official suppression, or is the current cycle ending, or is it something else? Is it possible for policymakers to orchestrate a situation in which their currency falls faster in value against the marginal currencies than to gold so as to insulate the rest of the complex from the rippling effect by discouraging the purchase of gold at the source – in the marginal currency? Or would that only encourage domestic gold buying instead? I don’t know for sure.
I believe that the USd has fallen much further than anyone expected would occur when it was peaking three years ago – excepting gold bulls like us but including anyone at the Fed. And certainly much of that has to do with the way inflation has or has not worked.
The way it has in the sense that it has returned everywhere at higher rates than during the nineties; the way it has not in the sense that the policy has not produced the results that the nineties (real) cycle had.
Instead, the observable results include falling PE ratios and higher equity risk premiums, the fueling of a commodity cycle (instead of higher PE’s), falling real wages (to create jobs – instead of productivity creating jobs), falling real interest rates, inflationary profits (which are artificial / ephemeral by definition), and the continued underperformance of assets in USd both caused by and causing these things reflexively in turn.
All of that explains the weak US dollar before policymakers’ intentions.
I don’t buy the idea that the Fed and Treasury designed it so that they would wipe out ALL of the gains made by the US dollar in foreign exchange during the 1990’s (in fact, recalling the analysis of M1, its stability alone explains the dollar’s ONLY foreign exchange surge (1995-2000) since the early eighties). Now, and this is tres importante, it is different to say that the Treasury wants a weak dollar policy than to say the Fed wants one. The Fed’s definition of the dollar goes beyond foreign exchange, the Treasury’s doesn’t! For its part, the Fed always wants a weak dollar.
I’m not saying that haphazardly, like I might say I would never invest in Russia or China.
It is 150% true.
At the beginning of the report I quoted Mises on the way in which variations in the value of money actually occur – not uniformly. This is important because it is the source of the redistributive power of an inflation policy. If money declined uniformly the policies causing such a decline would be of no use to ANYONE – even borrowers would simply have to pay more interest. It is because variations in the value of money occur one after the other as the money is passed through the economy – no change in value occurs until a further exchange does – that someone benefits.
 So
as far as the engine of inflation is concerned, the US dollar always DOES
fall in value against something but we don’t necessarily always
notice, and it may even be happening during a bull market in the foreign
exchange value of the currency (its exchange ratio against other inflationary
currencies). It may even be that some prices fall because the demand for
the wrong productive factors increases at the expense of the right ones
– right and wrong being in accordance with the main economic problem:
“to employ the available means in such a way that no
want more urgently felt should remain unsatisfied because the means suitable
for its attainment were employed—wasted—for the attainment
of a want less urgently felt” (Mises).
The foreign exchange value of money is only one relationship and the least real one – it is the domain of the Treasury department’s “currency policy.” So again, the Fed ALWAYS wants a weak dollar EXCEPT in times when it has to save it from the brink of annihilation (i.e. 1979 & 1987-1994) – from being expelled from “the constantly narrowing circle” of money.
But, whether it wants a strong or weak foreign exchange value depends on its specific aims – a trade scheme (redistribution of wealth from foreign nations) for instance would require that its FX value fall slower than its real domestic value – that it remains overvalued.
Now here we have the conundrum that has been bothering me: the trade data suggests that prices are rising faster in the US economy than abroad which is consistent with the decline in the foreign currency price of gold (for the most part).
However, if prices are falling in foreign currencies (instead of rising slower) it would suggest that the US dollar price of gold is now completing the bullish ripple in gold values that began with the foreign currency price of gold in the late nineties… that the gold cycle is nearing an end as the fresh impetus to the bullish gold cycle from the marginal currencies has ceased for now.
In other words, it would suggest that the USd gold price is just blowing off steam now in order to complete the (real) devaluation cycle that started with the foreign currencies in 1999 and that ostensibly ended in 2002 with a peak in the foreign currency price of gold.
However, unlike the Fed of 1987-1997, there is no slow down in inflationary impetus at either the Fed or the margin. Furthermore, from the point of view of a citizen of one of the countries whose currencies should be considered marginal (Canada) it is apparent that prices aren’t actually falling but rather that they are in fact just rising less quickly than they are in the US, making the implications of the weak foreign currency price of gold anomalous, or so it would seem. But all is not what it would seem.
 The
Australian central bank isn’t growing M1 (narrow money) at the 20%
annual rate it was in 2001/2002. Indeed,
Australian M1 peaked in March 2002 then shrank 12 percent over the next
year.
Since then it has recovered to its March 2002 level but has stabilized to just a 3% annual growth rate. Nevertheless, besides the fact that it supports our earlier contention of the relationship between narrow money and gold values, broad money is still growing at 10%, and 3% growth in narrow money is still inflation though maybe not inflation-ary. It is, at any rate, more inflationary than the Fed on average to this day, and moreover, besides the Bank of Japan, the others have been generally more inflationary than the Fed – which is important since it is relative to the US dollar.
The ECB has been growing narrow money at a faster annualized rate (7-12 percent) than broad money (5-8 percent) since January 2002.
The Bank of England is growing both M1 and M3 at double digit rates and the trend is conspicuously up in both cases – of course, the Pound has been a relatively weak currency and the Sterling price of gold has accordingly been relatively strong recently. These differences are all reflected to some varying degree. But except for the USd, Yen, Swiss Franc, and Pound, most of the other foreign currencies have seen real (gold) gains in their value over the past two years despite the inflation facts – though the Yen should not be in that list if it weren’t for the fact that the BOJ’s deliberate interventions keep it undervalued against the USd (boosting Gold:Yen), and also, Japan has been mulling abandoning its bank deposit guarantees. In any case, generally I want to pin the weaker foreign currency price of gold on the illusory but greater nominal returns offered in those marginal currencies at the moment, and which tend to compete with gold demand in the respective currencies.
That’s another way of saying that these currencies have overshot – not necessarily in terms of exchange rates (since the trade data suggests otherwise) but in terms of real (gold) values.
The monetary and economic fundamentals argue against a return of the disinflation-ism at any of the central banks let alone the Fed, and the data proffers scant evidence that the gains in real values for the marginal currencies is derived from real monetary restraint or related factors and that it is going to ripple through the currency complex like it did in the nineties. The trade data tells us that the foreign exchange value of the US dollar still has room to fall; the monetary data tells us that all the currencies are overvalued against gold for roughly the same reasons – the competition for domestic gold demand from financial assets that are stoked artificially through inflation policies (rather than really through the productivity miracle for instance).
In other words, the resolution to this state of affairs in our analysis is that gold prices begin to rise in foreign currency terms but faster in USd terms, which is basically the same as saying that the real (gold) value of the US dollar will fall faster than the US dollar’s foreign exchange value. It does not infer a bottom in the FX value of the US dollar. The case for a bottom in the foreign exchange value of the US dollar rests on the case for a reversal of the relationship between the foreign currency price of gold and the USd price of gold (POG). That is, when the foreign currency POG begins to rise RELATIVE TO the USd POG – which is the same as saying when either the foreign currency POG begins to rise faster than the USd POG or the USd POG begins to fall faster than the foreign currency POG. In our opinion, this inflection point will be marked by the coming down turn in most stock markets.
As a final reflection on our outlook above, recall that the foreign currency price of gold leads (for the relatively marginal currencies): of the divergences between the AD price of gold and the USd price of gold since 1971 where the AD price of gold peaked first there were only two instances where the USd price of gold did NOT follow suit, and where the continued rally in the USd price of gold forced the Australian dollar price of gold higher instead. Both instances occurred during the 1985-87 gold rally – the second best gold leg besides the current one since the seventies.
Although the AD price of gold bottomed first in 1985, it peaked twice during that cycle while the USd price of gold continued higher (like today); and both times the AD price of gold ended up breaking out higher. However, the final peak occurred in the AD price of gold first, and not long after its last break out higher. In any case, foreign currency gold price trends are important to monitor as leading indications.
Could POG Divergences Be Related
to a Suppression Scheme?
My initial hypothesis began as the idea that Gordon Brown’s target
was to hammer the foreign currency price of gold. That’s the thought
that inspired my research. However, one of the reasons it took so long
to complete is that my research continued to eliminate the related hypotheses
in favor of plain market influences.
In other words, the market fundamentals as covered above (relative inflation policies and financial asset returns) explain the gold price and foreign exchange trends as well as any reference to a suppression scheme – indeed; to the extent that the allure of financial assets is artificial it is as good as an official suppression scheme.
Investors are literally being fooled out of owning gold.
Yet, in light of the theory that the deterioration in the value of money begins with the marginal currencies there is the strong incentive for suppression schemes to target those gold prices; and in view of the monetary facts, the anomalous behavior of the foreign currency gold price further draws suspicion even if they are partly explained, and if only because they are only partly explained. So this question remains unanswered; I found no proof. So does the question of whether it would be more effective to target the foreign currency price of gold directly (through gold sales for that currency), or whether instead it would be better to intervene in the foreign exchange markets (in the current case it would suggest forcing the USd FX rate down faster than its real value loss).
The consequences of either policy would be to fuel the foreign demand for gold.
And indeed, demand is rising despite the weaker foreign currency price.
Furthermore, although our view remains that the US dollar fell of its own weight for the most part over the past few years, we cannot reject the hypothesis that the Fed knew there was a good chance that the dollar would fall.
If true, it implies also that they knew there’d be nothing they could do to prevent it.
Hence it’s possible that the Treasury deliberated a policy to help the US dollar fall faster in terms of foreign exchange than against gold in order to insulate the entire currency complex from further ripples in the real value of money; but I’m ruling it out on account that the trade data doesn’t suggest an overshoot in FX, and that instead the data generally suggests an ongoing undervaluation of the yellow metal in relation to everything, including commodities. Hence, to the extent the Brown/IMF rhetoric have had an impact directly on gold, it has created another buying opportunity.
Conclusions & Sector Outlooks
Inflation is the most significant determinant of monetary values, and
changes in foreign exchange rates aim to merely reflect its relative effects
on the real value of money... inflationary or marginal currencies fall
fastest (which is why the foreign currency price of gold leads the gold
cycle) and the dollar system is only as strong as its weakest link…
gold price variations ripple through the entire currency complex according
to the monetary fundamentals… the monetary and trade facts suggest
that the PACE of the decline in the foreign exchange value of the USd
relative to its gold value is not sustainable, and further that the foreign
currency POG is undervalued... the everything is okay syndrome is the
most direct reason the foreign currency price of gold remains weak…
the trade data (and intervention facts – BOJ) suggests the FX value
of the US dollar has room to fall, while the monetary data suggests gold
is undervalued in both currencies… Finally, market influences are
much more prominent than official suppression in explaining the divergences
(the weak foreign currency price of gold), but anti-gold rhetoric always
offers a good buying opportunity nonetheless.
 The
gold sector is breaking out right now at a time when the seasonal window
should be closing, which supports our view that there remains unfinished
business before it peaks. Our outlook
for the USd is basically that it continues to fall in terms of both, foreign
exchange and gold, but that it begins to fall faster against gold.
Our target for the USd index is roundabout the early 1990’s lows at 78; our target for the USd price of gold is for it to drive through US$500 in the first half. If this outlook is right I expect the HUI to gain 20% in that period unless our gold targets are too conservative. We’d still rather err on the long side of this bet!
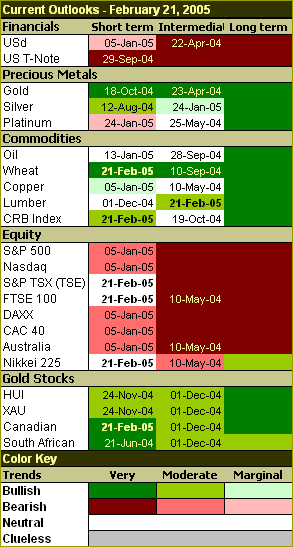
Our conclusion is to buy the gold sector on weakness, and sell stocks and bonds on strength. The USd (FX) will give us trouble in the not so distant future but not until we see gold blow off past the US$500 mark.
I made some minor changes to our short term outlooks: the strength in copper, wheat, energy, and the precious metals persuaded me to upgrade my short term CRB outlook to moderately bullish from marginally bullish; but I continue to believe that the best commodity gains in the near term will belong to gold & silver, but especially gold. Stock market technicals for the TSE, FTSE, and the Nikkei look too strong to remain bearish on those trends (for the short term at any rate); but for the US and other European markets there is enough erosion in the technicals to keep us bearish.
 Lumber
looks overbought short term but the nature of its recent advance argues
for a more bullish intermediate outlook. The wheat chart looks VERY attractive
here...
…if you trade commodity futures.
Finally, since we remain steadfastly bullish on the foreign currency price of gold and because of the performance of the Canadian gold sector last week, we’ve upgraded our short term outlook for the TSE gold and silver sector.
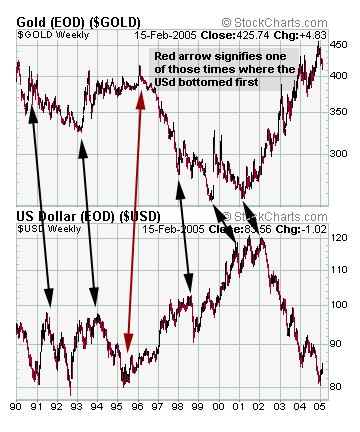
As a final note on the US dollar, and in particular the lead role that gold has in forecasting USd trends, note that in the chart here gold has already taken out its 1996 high – could that mean to suggest the USd is going to fall through its 1995 low??
P.O. Box 4642
V.M.P.O.
Vancouver, BC
Canada
V6B 4A1
Phone: 1-604-941-7059