Special Report: Gold Stocks
The Road to $1,000 - which producers are best positioned
May 24, 2004
a currency & gold market analysis
by Ed Bugos
| Print Copy | ||
| Highlights: | ||
| The meaning of value investing |  |
|
| The current outlook for 2004 | ||
| Preferred valuation methodology | ||
| The top gold stock values in each category | ||
| The most sizzling growth story yet | ||
| Best book & reserve value | ||
| Blue sky in Chile | ||
| A new dividend player? | ||
| Conclusions | ||
There is no best method of calculating valuation. They're all bad. Besides, that's what the market is for - determining values. All we do by calculating them is estimate.
Just ask your accountant how reliable his or her estimate of book values is if you don't believe me. When we say we're looking for value it usually means value the market hasn't realized yet but which we expect it will for one reason or another.
However, there is no such thing as buying value if its only determinants are the past. Without consideration to the future and whether the market will realize those values the supposed process of value investing is as useful as a mechanical trading system rigidly fixed to past data; maybe even less when you compare the performance of so-called value investors in general over time. At any rate, both processes mechanistically presume value but assume that it will be determined the same way in the future as in the past. The past is important naturally; but "only" in relation to some concept of the future where value is usually determined. There are usually clues in the past data about the company's capability to produce value in certain environments, and sometimes in the balance sheet there can be found values the market hasn't duly considered.
But by and large, the value that investors perceive in the present however discovered can only be realized in the future as other investors also perceive them.
There would be no point to value investing if it didn't involve the expectation that participants will one day recognize it. Nonetheless, the best gains rarely arise from perceiving value in the balance sheet before the crowd. In fact, more often, stocks that seem to be trading cheap on a book value or PE basis simply get cheaper; the market is more interested in the future usually… specifically, those things that will "change."
The investor that anticipates real change before others do is most certainly value investing. That's what it's all about. I'm not talking about the greater fool theory here. I mean investment strategies planned on a well-thought out outlook for the future. He or she is as likely to be wrong as the mechanistic value investor.
Analysts who charge that gold stocks are overvalued because they're trading at record multiples do not see $1,000 gold. If they did, value would suddenly be perceived where it wasn't before. The value in gold stocks as a sector, as far as I am concerned, is that they are selling a commodity which we believe is itself undervalued. For the sector as a whole, the changing outlook for gold prices is almost the sole determinant of value.
The fact that it is difficult to predict commodity prices, or any market for that matter, does not let the investor off the hook. Buffet may say in public that he prefers not to predict markets but then he buys silver - if he's not assessing its monetary value then he must at least be expecting some future resolution of industrial supply and demand in his favor. For there is no way to determine the value of commodities without reference to the future… they don't have a balance sheet! Whatever gains he expects to realize they are also in the future.
In my experience, when money managers say they try not to predict the market, what they really mean is that their strategy doesn't depend on the market's prognosis entirely, or sometimes at all. For instance, when we suggested that investors curtail their purchases of gold shares and even sell them in the last half of 2003, we were not making a market forecast. We were acting on developments in a way that would allow us to benefit even if they continued to go higher in the short term. If we were making a forecast I would have sold everything.
The investment strategy must embody more than one possible scenario (or outlook). That's the best way to manage risk that I know of (which could include the use of derivatives; in fact, that is their utility). It's not possible to be right all of the time but the performance of your portfolio need not suffer because of it.
The Current Outlook, 2004 Could Be Choppy
It's not always the case but I do find that the short and medium term
is a tough call today. Notwithstanding this, I am still of the opinion
that the timing for buying gold shares is excellent. What would you expect
a gold bull to say?
You know me; I'll say what I think.
Zacks.com (www.zacks.com) has been publishing my articles for almost two years. Every January they like to ask their writers to put out their favorite picks. We did this at the beginning of 2003 but I remember being cautious at the time for the same reasons as later in the year… the short term timing wasn't great. However, I felt that the medium term presented a terrific opportunity even if it started a few months later than I'd anticipated. This year, however, I've put off publishing a gold stock issue entirely because my medium term outlook turned much less sanguine. Instead I wrote, in January, that there would be a sharp correction in 2004. Recall:
"Since 2000, however, gold prices have surged more than 60% from trough to their recent peak at $428. The leading gold share index (AMEX Gold Bugs) has surged an astounding 600% since late 2001 when the Bull Run began. By contrast, the XAU is up only 165% in that period, while the Johannesburg gold share index is up 240%. Most (bullish) gold share investors have at least doubled their money over the past few years. This has occurred amidst a general bear market in the broader equity hemispheres - one that is increasingly challenged - and a 30% drop in the value of the international reserve currency, the US dollar… the world's current, but bad money!
Precious metals mutual funds have been among the best performing funds of the market for three years running now. Even in 2003, a year when the Dow Industrials roared back 25%, gold shares outperformed most everything but the most speculative technology and foreign country funds.
This gold bull is hot. But now comes a time for many investors to make a decision in their investment strategy. Nothing goes straight up, or straight down. And doing nothing also involves a decision.
It could well be the best decision. For, in light of our long-term view of the gold market, gold stocks are still cheap today. However, gold stock corrections - when they come - can be steep, particularly at the early stages of a developing bull market. We expect reversals in many markets during 2004, and consequently, an interruption to the gold share bull market sometime after the first quarter or maybe sooner" - January 2004.
I did not expect the correction to take this path though. I only expected a pullback first, followed by new highs, and then a correction - perhaps a little steeper than the current one - later in the year around the election. As wise as our strategy appeared to be our actual prognosis was most certainly denied, or at least interrupted.
Our current enthusiasm for increasing the gold share allocation stems from my confidence in the long term gold price outlook - they are cheap on that basis. The difficulty with the medium term outlook is this: my prognosis for gold prices is that they are about to charge upward to around $500 and then succumb to liquidation perhaps worse than the current one in extent from peak to trough.
At their highs in December, gold shares were discounting a $500 POG; so I don't imagine they'll be able to go far past their highs if gold doesn't go far beyond $500 on this stretch - especially if it is followed by a more important "primary" correction in bullion. Still, my short to medium term outlook now is for higher highs in gold stocks, even if only moderately beyond December's highs.
No point crying about the volatility - it'll be worse elsewhere. Might as well exploit it.
I wouldn't be surprised to see a choppy market in this sector until after November. But that's the pessimistic me talking because I really wouldn't be surprised to see that we're not being bullish enough about the medium term as well. In my view, this market should be flying on the inflation confirmation we're getting. The ONLY reason my enthusiasm is not more apparent is because I've adjusted to the reality of gradualism - on the part of investors gradually figuring out how they're getting hooped.
But if there is one thing I've learned in the market it is that just when you've adjusted to its rules, it changes them on you. Just when you've adjusted your strategy to buy the dips instead of the breakouts the market falls lower; just when you've adjusted your strategy to look for growth the market likes value; just when you've figured out that the market breaks out of the rectangles on the upside it breaks out on the downside… etc.
However, having studied the long term charts of various gold stocks during the '62-80 bull market in gold my findings also warrant further caution at some point over the year. Recall this chart from our May 4th issue:
It's a logarithmic chart so everything is in percentages.
We've already discussed the possibility of greater volatility in the intermediate swings today (see the issue - "The Wheel and Gold"). In my view the budding bull market in gold has still not completed its first stretch, but it is near. What is missing is the climactic ending that we've seen in the other commodities, and which I think is just about upon us. I think we're going to see talk of a dollar crisis where before it was just a difference of opinion over whether its decline was deliberated or not.
In the chart above, preceding each primary correction was a top. The 1968 and 1974 tops were affairs that lasted more than a year before the liquidation phase really began.
By contrast, the top we've seen in gold stocks so far today before the surprise April liquidation was only four months long. One interpretation is that it wasn't a primary top.
Another is that a top could still be in the offing, and the current correction is but a part of it. So my outlook for the medium term is kind of a guarded optimism.
I'm optimistic that we'll finally get our major bull market signal in gold (through the 1996 high once and for all) and that gold shares will benefit more than I have been conditioned to expect; but I am leaving room in our prognosis for the possibility that the waters are going to remain choppy in gold shares until gold prices are ready to enter the second stage of the bull market - by sometime next year in my outlook.
In this environment I think it's best to adjust the strategy to the long term outlook where there is more certainty in my view. To that extent the current correction has provided the most opportune entry point for the sector since 2001, which is what motivated the timing for this report that I postponed at the outset of the year.
Perhaps if investors are currently wary, it'll at least prepare them to act if they suddenly turn bullish as I am.
The Preferred Strategy
The allocation in the table below reflects my subjective rankings of where
I think the best opportunities generally are in the market overall. We
are not overweight gold shares as was the case up until last September.
As you can see in the table here we are long more gold 'bullion' than
gold stocks at the moment because I still expect gold to outperform the
stocks beyond the short term, though not beyond the medium term.
Naturally, it is reasonable to ask why I'm not short the bond if I'm so bullish on inflation, if you will. The reason is that I believe there is more downside to be realized in the stock market from a rout in bond prices. Besides, being long gold and short the dollar mirror a bond short, and perhaps are more rewarding… or have been at any rate. It also reflects my conviction that the Fed still has a degree of relative influence in bonds where it might not in gold or the currency any longer.
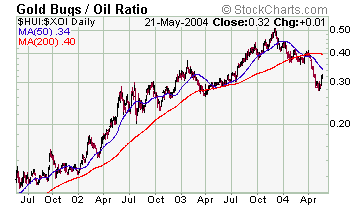
 In
hindsight it may be critiqued that I should have been long more oil. I've
been bullish on oil all along but on a relative basis I've preferred the
gold sector. This was the right move for most of the past three years
as you can see in the chart of the HUI/XOI ratio below. Even for most
of last year gold prices outshone oil and gas prices.
In
hindsight it may be critiqued that I should have been long more oil. I've
been bullish on oil all along but on a relative basis I've preferred the
gold sector. This was the right move for most of the past three years
as you can see in the chart of the HUI/XOI ratio below. Even for most
of last year gold prices outshone oil and gas prices.
But over the past few months I've started to feel underweight in the oil sector. I think it's the wrong emotion though because the gold/oil ratio is at its worst in three years - which itself was a record low. I think it's right to be bullish on oil but I think that it only supports the bullish case for gold, which at this point means gold should outperform.
 First
time investors: would probably never buy a dip in gold stocks
like this. If they did I would definitely commend them; but if they weren't
already long gold after the breakout in the HUI last year it is not likely
that they would view this as a buying opportunity. Not enough has changed
- the inflationary trend was already put in place and if they didn't see
it then they aren't likely to see it when the sector is reeling. There
is more evidence of inflation, true, but perhaps not enough to get the
blind in gold stocks when they're falling is all I'm saying.
First
time investors: would probably never buy a dip in gold stocks
like this. If they did I would definitely commend them; but if they weren't
already long gold after the breakout in the HUI last year it is not likely
that they would view this as a buying opportunity. Not enough has changed
- the inflationary trend was already put in place and if they didn't see
it then they aren't likely to see it when the sector is reeling. There
is more evidence of inflation, true, but perhaps not enough to get the
blind in gold stocks when they're falling is all I'm saying.
Notwithstanding, there is the view that some of the big boys, having missed it, orchestrated this latest correction just to get on board. I won't rule it out. But if it's true the correction should be over like now. At any rate, all I can say if you don't believe is that this is the time to delude yourself into believing… the risk of being wrong on the entry point has washed out considerably.
This is the time to acquire a core gold stock position if you haven't already got one.
Traders: should have been all over the buy side of the dip in the prior week. We're getting a bounce now but as for what to do in the short term will depend on how we approach the resistance points above. It's probably wise to maintain a contrarian strategy with regards to trading the sector over the short term; but with a bullish bias.
If the strategy is aimed at a one-year outlook or less the timing for a long bet is good but not good enough to justify an overweight position (relative to the weighting in bullion for instance). I would absolutely avoid shorting this sector except on a huge unsustainable spike. But I would buy the dips and sell the rallies if I were going to trade it (as opposed to buying and selling the breaks).
Long term investors already long: I think it goes without saying that they should be adding to their gold share positions here if they were able to take profits last year. Otherwise it's probably good to sit pat. However, while I don't endorse short term trading, I do advocate reducing and increasing exposure when the balance of risk and reward has shifted too obviously. In other words, if we get our new highs in gold stocks on a spike in gold to $500, we may give back our recently acquired exposure, and would suggest that long term investors don't hesitate in taking profits when sentiment gets too bullish in the short run… if only so that they can afford to increase their long term position gradually by buying dips like this as a result.
Bearish investors: should run.
My Preferred Valuation Methods
Before I get into the comparison, let me expound some theory. You can
skip this section and come back to it afterwards if you wish - if you
still need clarity. But I'd suggest quickly skimming it anyway.
There are two generally accepted ways to value gold stocks: net asset value and cashflow multiples. I prefer the latter because it's simpler, investors tend to act according to their near term cashflow expectations anyhow, and because it involves fewer rigid assumptions. It is also more market driven in my model - instead of arriving at a theoretically appropriate cashflow multiple by first determining the proper economic cashflow and testing against various inflation and interest rate environments, etc., I apply a fair value multiple that is based on an actual long term average range of multiples for the blue chip producers (basically Barrick and Newmont), which I adjust according to the interest rate level as one would in their net asset value calculation.
One could say Newmont's long term values act as my benchmark valuation yardstick against which we compare others in the sector. Hence, the fair value multiple ranges from 8 to 15. When interest rates are relatively high we would apply the lower multiple and vice versa; today a 15x multiple would be justified because of the low level of interest. However, I have been using a 12x multiple because I expect that situation to worsen. These are subjective estimations - as I prefer because the world changes too quickly to rely on a strict formula in my view. Still, this measure too is inadequate.
As is the case with the PE ratio or any valuation multiple, those shares that trade at lower than average multiples (and vice versa) frequently do so for good reason.
Maybe there is something wrong with their assets, or cashflows continue to drop, or they have less growth potential than others, or less diversity, or less quality, or maybe there's political risk that is considered as to its impact on future profits. And maybe all these things are real and provide good reason for why a particular company or other should or does trade at a premium or discount.
Sometimes we have to pay up for the true values. And sometimes - if the sentiment is very bearish for the sector as a whole for instance - it is possible to buy the best values cheap. I generally cringe at buying the "apparently" cheap stocks in a sector - like the South African gold shares today for example. But I felt the divergence between those values and the N.A. shares grew too large to sustain. The seemingly clear lines between political instability over there and stability over here are likely to become grayer as the bull market in gold grows. I believe the North American producers will fetch a premium for some time to come but just not as big a one as they are getting today, which owes much more to the fluctuations in the Rand price of gold than any political trends in my opinion. The valuation of reserves is much more difficult.
Some producers (notably the South Africans) have millions of ounces of additional resources on their balance sheets and rarely grow their reserves, or production (or do so slowly), while others have hardly any reportable resources but are able to grow their reserves and cashflows regardless. One reason for this lies in the different reporting standards for reserves and resources. Australia, Africa, and North America adhere to different codes. Another reason, however, is economic. The South African resources are more easily inferred due to the above average continuity of the geology in the region, yet aren't necessarily economic to mine because they can run very deep and require large capital injections. Other regions or producers find that while they can't quantify their resources as easily they can often mine beyond their original estimates.
Sometimes management is very confident that the reserves are there and is right; sometimes they are very confident… and they're wrong. But the gist is that as it is with cashflows, there are sometimes good reasons that a market will discount the company's reputably vast reserves, and vice versa.
The bottom line is that an investor would probably do better buying the expensive shares in a cheap sector than the cheap shares in an expensive sector… usually.
As gold prices rise to $1,000 it is common for the earnings of leveraged producers, and hence their stock prices, to rise even faster than gold. Whereas in a sector recession the leveraged producers fall fastest perhaps because they have the most trouble managing their costs to begin with, a gold bull market tends to have the opposite effect. Thus, in our model we impute some positive value for leverage - but it only holds well under the bull market assumption. The same goes for the negative value we attribute to any hedge books; in a bear market they would probably have a positive value.
However, together these factors only achieve about a 15% weighting in my model. For the reasons discussed earlier I'm trying to construct a model that doesn't rely solely on book, reserve, and earnings multiples; but also includes a score for growth potential, dividend potential, asset diversity, and actual net operating performance.
Book and reserve values in my model make up just a little more than half of the total valuation score for instance. But I don't want to promote this model as the be-all-end-all because it isn't. I'm adjusting it frequently. It's but an exercise in judgment at the moment.
 For,
it is disputable what the appropriate weightings should be. Here they
merely reflect what I am looking for, which are usually producers with
growth potential and some depth to their reserves.
For,
it is disputable what the appropriate weightings should be. Here they
merely reflect what I am looking for, which are usually producers with
growth potential and some depth to their reserves.
The producers that will do best, I think, on the road to $1,000 are those with the most earnings sensitivity to the underlying commodity price, those that have the most capacity to raise dividends "or" grow production, as well as those that can offer an extent of blue sky that the market jumps on when the fever strikes.
I can't cover everything but I'm slowly increasing the pool of gold producers that I do. This week we've added Eldorado and Durban Deep to the list, which now includes 18 gold stocks whose developments I am monitoring closely. Eight of these are in our index (Gold Fields, Goldcorp, Glamis, Harmony, Kinross, Meridian, Newmont, and Randgold). You'll see who the others are in the graphs below.
Nevertheless, for the purpose of this report we'll assess the whole group without bias.
Best Values in Each Category
Starting strictly with our quantitative model, the following values are
produced for the best five in each category of the eighteen producers
in our comparison:
Of course, it doesn't make me feel much better to own the cheapest of the group since they continue to perform miserably.
At any rate, in the following analysis I mean to highlight the one producer that shines most in each of the five subcategories - going beyond the strictly quantitative application (I'm mostly excluding the silver stocks here because I prefer the gold producers at this stage; but Coeur d'Alene is already in our group).
The Most Sizzling Growth Story
Companies like Wheaton River have produced exceptional growth. From $30
million in annual sales prior to 2002 Frank Giustra et al have grown this
company to produce more than $300 million in revenues only two years later.
In that same short period reserves and production have essentially grown
from nothing to more than 5 million ounces and 500,000 ounces respectively.
The latter is expected to double again by 2007.
But shares outstanding have grown enormously - from under 100 million in 2001 to almost 800 million today - so that on a per share basis the figures don't stand out as much. Without taking anything away from this outstanding accomplishment it isn't what we're talking about when referring to growth.
We're looking for those companies that can sustain that kind of growth in their per share values. It's true that Wheaton's shares have performed really well despite this method of growth; but that owes to the fact that they started with nothing. Going forward this process will probably only be dilutive to the current shareholder base.
If I were wrong everyone would do it; even Newmont. It's a method that is effective at the junior level. To come to a conclusion about "future" growth potential we have to look to other clues. I assign a relatively small significance to "past" growth. Wheaton scores high in actual growth but it scores low in growth potential, so it doesn't make the top five. I determine growth potential three ways:
- Estimated reserve life: proven & probable reserves divided by this year's production - this is different than mine life; mine life includes an estimate for the life of the capital deployed.
- Resources over reserves: measured & indicated resources compared to P&P reserves can identify those producers that have the largest pool of resources from whence to grow reserves and production.
- Next year's production: a weighting for near term gratification.
Some producers score high in both #1 and #2, like Glamis, Harmony, and Gold Fields; while others score higher in the first category than the second. Eldorado has a high ratio of P&P reserves to annual production and a more average resource to reserve ratio while Bema is the opposite (Bema's resource to reserve statistic drops to approximate Glamis', Harmony's, Durban's and Randgold's if you exclude the Cerro Casale deposit in Chile).
Of the five best values in the growth category produced by our quantitative model I'm going to exclude Anglo and Gold Fields because their size will probably restrict them from the same growth that the other more intermediate producers might achieve. Hence, in this category that leaves us with a comparison between Bema, Eldorado, and Glamis who produce from 100,000 to 300,000 ounces of gold per annum currently.
There are three additional things to consider in narrowing it down: asset quality, mine life (different from reserve life), and expected LT production growth. The latter two are forecast in the table below; the basis for the forecasts is the company's own comments for the most part. Bema's figures below exclude the Cerro Casale but are impressive still.
In terms of the most percentage growth in production to 2007 they are all roughly tied.
Eldorado Gold recently announced a setback - higher costs than anticipated for their Turkish development project. While it is a trend not unique to Turkey, the imposition of a huge value added tax by the government might be overkill and dampen some enthusiasm about the profitability of the mine and other prospects for Turkey.
At any rate, all three are expected to triple production over the next three years.
Bema's production profile grows slower at first but gets a big potential boost in 2007 if management is correct about its enthusiasm for the Kupol deposit (a 75% owned Russian discovery estimated to contain 9 million ounces of gold at a rich grade of better than half an ounce per ton, and more than 100 million ounces of silver averaging about 10 ounces per ton). The resource is still growing.
However, Bema's core assets (current producing assets) are either depleting or marginal in nature, and its long term future consequently hinges on the development of the Russian discovery. The same could be said of Eldorado whose current mine has maybe a six year mine life. Its future rests with the Turkish project.
 On
the other hand, while Glamis might offer slightly less blue sky it is
remarkably diversified for such a small producer, has better quality core
assets, has been around the longest, the longest mine life at full potential
production and the most upside in production by 2007. It ranks most consistently
at the top of the list in terms of growth, and as a result I think it
is the best pick in the growth category in terms of risk / reward…
almost confirming our model, which ranks it second behind Eldorado.
On
the other hand, while Glamis might offer slightly less blue sky it is
remarkably diversified for such a small producer, has better quality core
assets, has been around the longest, the longest mine life at full potential
production and the most upside in production by 2007. It ranks most consistently
at the top of the list in terms of growth, and as a result I think it
is the best pick in the growth category in terms of risk / reward…
almost confirming our model, which ranks it second behind Eldorado.
Glamis Gold: Five-Year Plan: "With the growth in reserves and the rapid development of the El Sauzal and Marlin gold projects in Mexico and Guatemala, Glamis expects to exceed its near-term objective of producing 500,000 ounces of gold annually by more than 100,000 ounces and achieve this goal a year ahead of schedule. The Company now anticipates gold production of over 600,000 ounces in 2006 and 700,000 ounces in 2007, at estimated total cash costs well below $150 per ounce" - Feb 6 2004 company news release
Bema and Eldorado are cheaper based on current cashflow projections, so they probably have more upside than Glamis in terms of share values; but I view Glamis as a more stable less risky grower. We're buying one of the more expensive ones (based on traditional valuation yardsticks) in a cheap sector!
In Glamis' case the market has priced in its growth at current gold prices. But I'm not sure there will be a more timely opportunity to buy it - it's one that investors just might have to pay up for. The market has priced the growth in production at Bema and Eldorado with less conviction. In all three cases, however, where the growth has been priced or nearly priced, the effects of higher gold prices haven't been factored.
Although slightly cheaper, both Eldorado and Bema are the more likely candidates for share dilution arising from the future financing of development projects, rather than Glamis who is in a stronger financial position overall.
Glamis' current cashflows are expensive; but there is plenty of upside to be realized from tomorrow's gold prices. Another way to look at it is that although its production growth has been factored, unlike others in the sector, the market is only pricing that production at a $400 gold price, and it is not pricing any growth beyond 2007. It's the best growth play in the sector in my view.
Best Book & Reserve Value
 The
South African producers dominate this more traditional category. They
offer the lowest multiples on current cashflows and the lowest reserve
and resource values in the sector per share (or per ounce) as you can
see in the graph to the right. On this basis stocks like Glamis and Bema
are frightfully expensive. But this measure of value is not a good one
for the reasons I mentioned at the outset - it attempts to find value
in past or known data.
The
South African producers dominate this more traditional category. They
offer the lowest multiples on current cashflows and the lowest reserve
and resource values in the sector per share (or per ounce) as you can
see in the graph to the right. On this basis stocks like Glamis and Bema
are frightfully expensive. But this measure of value is not a good one
for the reasons I mentioned at the outset - it attempts to find value
in past or known data.
Notwithstanding, I also like buying value on this simple basis, which is why we probably own stocks like Harmony and Gold Fields. Anyhow, leaving Placer Dome out on account that it is one of the larger hedgers (unfortunately because it actually has a terrific portfolio of resource properties), the gold shares that offer the best values in terms of the value of their reserves, current cashflows, and relative to balance sheet statistics (adjusted for asset diversification) are Harmony, Gold Fields, Kinross, and Randgold. Agnico Eagle scores high on reserve value but low when it comes to assessing cashflow multiples and mine diversity. In this category as it depends on a process of elimination I have to rule out Kinross and Randgold as well because their mines have comparatively short lives on one level or another. I don't see much potential for production growth at Kinross in the medium term; though Randgold is expected to almost double production by 2006.
I think Randgold is a buy because it is cheap and offers more nearby growth; but Gold Fields and Harmony are the most obvious blue chip value plays in the whole sector (in my index I would have replaced Kinross with Durban Deep if we didn't already own the other two overall cheaper South Africans).
Gold Fields produces about 4 million ounces of gold yearly while Harmony produces about 3 million ounces. The former is also about 30% larger in terms of the amount of reserves it controls. I'm not sure we can say Gold Fields has more political clout in South Africa any longer but it has much more attractive growth, performance, and cashflow ratios than Harmony so we have to award it the best ranking for this category of book values.
However, we calculate that Harmony might have the best leverage to any step up in the Rand price of gold. Its operating performance has seen the flat end of the hammer for most of the past year due to rising costs and flat Rand gold prices. But this is also the source of its leverage should these factors relent even a bit.
In the calculation of NAV and FMV in the tables in this report I include cash holdings per share. However, I also assume fixed costs, which may hold good for a while but not for long if gold is going to $1,000 an ounce. It shouldn't matter much in a relative comparison between two companies producing in the same region as is the case here.
Nevertheless, I still expect the Rand price of gold to rise faster than production costs in South Africa en route to the $1,000 target level for US dollar gold prices.
Blue Sky in Chile
This is a subjective category that will draw diametrically opposing viewpoints
and disagreement. But I'm going to go with the more obvious. Growth could
be a variable here but I'd rather highlight projects that are not so certain
or already factored into prices, yet could have a large bullish impact
on share values if they were.
Two companies stand out automatically: Bema and Meridian. In Bema's case the market hasn't placed too much faith in the future of the Cerro Casale deposit in Chile (Copper-Gold JV with Placer and Arizona Star). Without alluding to the probability of success, I'll just make a brief assessment of the potential value of any potential success. The details in the feasibility study of the Cerro Casale deposit suggests that Bema's interest is worth roughly $2 per share on a cashflow basis (slightly less on a NAV basis).
Bringing this project on line is Bema's blue sky. It would more than triple its reserves and production; including consideration to the Russian project discussed earlier, instead of 700,000 ounces by 2007 the company could become a 1 million ounce producer if all goes well. However, I find Meridian a compelling story.
Although it doesn't have an exciting growth profile for production in the near term the market has discounted its shares to exclude entirely the value of the Esquel project in Argentina that it acquired in 2002.
Meridian (created from a spin-off of FMC Gold in 1995) discovered the El Peńón deposit (its main mine) in Chile in 1994 (prior to the spin-off) in a region "that had no previously recorded precious metal occurrences." The discovery hole yielded 100 meters of 11 g/t at about 100 meters depth. By 1997 they announced a reserve, and by 1999 it was put in production. The company has replaced every single ounce it has ever mined at El Peńón through an ongoing process of discovery. That's remarkable in itself.
This month with the release of their first quarter report they announced a further discovery at the El Peńón site, which may add up to 1 million ounces in reserves (heard on the street; a few hundred thousand at any rate).
Meridian produces about 320,000 ounces a year; it is basically in the same league as Agnico Eagle, Goldcorp, Bema, Eldorado, and Glamis. Management wasn't prepared to forecast or confirm the numbers but did say that where production was expected to taper off after 2007 it no longer is… due to this discovery.
 In
Meridian's case, the blue sky is located in two places: Esquel and the
exploration upside at El Peńón. The latter is open ended; I'm excited
about this company's exploration record - past and present. At any rate,
should the dispute at Esquel ever be resolved, it would add a growth dimension
to near term cashflows as well - production would almost double to about
500,000 ounces annually. Although I seem to be partial to Meridian and
Glamis over Bema, the latter is certainly a tempting speculative buy at
this level. I just happen to think that Glamis has a better growth story,
and Meridian is a cheaper way to acquire blue sky.
In
Meridian's case, the blue sky is located in two places: Esquel and the
exploration upside at El Peńón. The latter is open ended; I'm excited
about this company's exploration record - past and present. At any rate,
should the dispute at Esquel ever be resolved, it would add a growth dimension
to near term cashflows as well - production would almost double to about
500,000 ounces annually. Although I seem to be partial to Meridian and
Glamis over Bema, the latter is certainly a tempting speculative buy at
this level. I just happen to think that Glamis has a better growth story,
and Meridian is a cheaper way to acquire blue sky.
Other variables that I like about Meridian include its strong balance sheet and cash position (almost $2/share in cash holdings) as well as its lucrative cash profit margins - total cash costs at El Peńón came in at $54 per ounce last year. In the table here I'm including the Esquel deposit in the calculation of reserves, potential cashflow power, as well as FMV & NAV.
I also like its demonstrated ability to grow internally as opposed to through share dilution / acquisition. Since inception the company has only issued a significant quantity of shares once - in 2002 for the purchase of Esquel. However, it has such strong margins and capable exploration staff that it might be fair to presume minimal future dilutions, especially compared to its peers needs.
New Dividend Player?
Which producer is going to pay the most in dividends in the future? If
we went by who's paying the most today it would be AngloGold, Harmony,
and Gold Fields - averaging about a 2% yield. This is low by historic
standards (and relative standards among the cyclicals) but not necessarily
that low compared to the broad market.
So why do I care? Because when gold prices go up meaningfully it all flows through to the bottom line as free cashflow. Such boons to the bottom line in most industries don't occur except if there's growth in productivity. But due to the inflation prone dollar, it occurs frequently enough for the commodity producers. In any case, when it does the company can turn around and invest it in larger production facilities or exploration but usually it discovers the best use for the free cashflow is to pay out dividends - because in a hot market it's often too expensive to invest in growth at the time and because in the commodity business the opportunities for growth are usually hard to come by in the first place; they depend on discovering new reserves.
Most producers - except for the hedgers - have fixed their wounded balance sheets over the past few years. As cashflows increase from this point onward managements are probably going to increasingly consider paying out their excess profits in dividends, especially if governments encourage dividend paying stocks like the US administration did in its tax plan. Goldcorp has demonstrated a proclivity for this already. And cash is piling up in producers' coffers in many cases elsewhere.
It is tempting to pick the producers with the lowest cash operating costs (like Goldcorp, Randgold, Meridian, and Wheaton) as the most likely candidates to pay out dividends in the future. But because they are relatively small my guess is they will prefer to concentrate on growth for a while yet.
Nevertheless, I'm going to stick my neck out and predict that Goldcorp will become a reliable dividend producer in the future. I'm only speculating but I think management would find it one of the most useful destinations for its strong cash flows, and in promoting its stock price. The company has had a good track record at finding and increasing reserves but the market has already factored this and it is going to have difficulty standing out among the other growth stories as a result. The value that the company's program of holding back inventory and selling it higher holds for shareholders is precisely that it can maximize profits and pay them out in dividends.
 In
2003 the company paid out about 10 cents in dividends, but announced a
20 percent increase at yearend and the decision to pay them out monthly
instead of bi-monthly. During the 4th quarter of 2003 Goldcorp sold its
entire stock of bullion (accumulated earnings) for about $50 million and
promised to pay out a special dividend with the proceeds this year. Thus,
for 2004 the dividend is forecast to rise to 28 cents per share. While
this is still only a 2.4% yield it is approaching the highest yield or
payout in the sector at the current moment, and essentially confirms my
hunch. Second in line are Newmont and Wheaton. Newmont is probably more
of a sure thing with respect to dividends.
In
2003 the company paid out about 10 cents in dividends, but announced a
20 percent increase at yearend and the decision to pay them out monthly
instead of bi-monthly. During the 4th quarter of 2003 Goldcorp sold its
entire stock of bullion (accumulated earnings) for about $50 million and
promised to pay out a special dividend with the proceeds this year. Thus,
for 2004 the dividend is forecast to rise to 28 cents per share. While
this is still only a 2.4% yield it is approaching the highest yield or
payout in the sector at the current moment, and essentially confirms my
hunch. Second in line are Newmont and Wheaton. Newmont is probably more
of a sure thing with respect to dividends.
I think Anglogold's cashflows will be tied up in the liquidation of its hedges for a while and the South African producers have to regain some control over costs before they can resume their traditional leadership in this category of value.
But I think Goldcorp has a lot to gain from putting itself in the dividend paying league if it hasn't decided to already.
Conclusions and ST Activity
For better or for worse then, the following deals consistently show up
as good values.
I'll wrap this up with a few comments on their technicals.
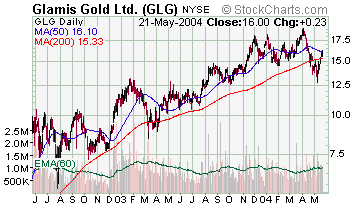 Glamis:
Glamis' shares fell through the last highest low (as did the whole sector)
but it is one of the few (besides Wheaton) that has recovered to above
its 200-day moving average.
Glamis:
Glamis' shares fell through the last highest low (as did the whole sector)
but it is one of the few (besides Wheaton) that has recovered to above
its 200-day moving average.
However, it is still behaving as would be expected within its longer term trend channel. On a relative basis the technicals are strong. The correction in Glamis was less severe than what occurred in the rest of the sector; but on most counts it was still as oversold as it has been in three years. The recovery through a neckline is a bullish factor but means little technically so far except that the bulls are answering the bearish call.
Goldcorp: Goldcorp's chart looks a lot like Glamis' except that its recent correction was more severe - owing to news (management shuffle and insider stock sales, etc.) - and its trend channel wider.
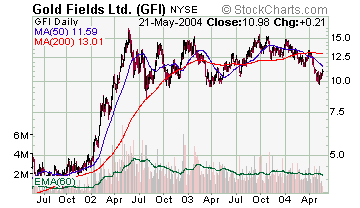 Gold
Fields: Since the explosion in its share price in early 2002 when
the South Africans still led the way Gold fields has been stuck in a wide
$6 or $7 trading range. Due to my bullish long term outlook I view it
as a continuation pattern and the stock should be bought on every dip
to the bottom end. It is encouraging that the lows are generally higher
even if the latest trough threatened to move lower.
Gold
Fields: Since the explosion in its share price in early 2002 when
the South Africans still led the way Gold fields has been stuck in a wide
$6 or $7 trading range. Due to my bullish long term outlook I view it
as a continuation pattern and the stock should be bought on every dip
to the bottom end. It is encouraging that the lows are generally higher
even if the latest trough threatened to move lower.
The technical objective on a breakout to the upside is $25 per share, or more if you use the 2002 move as a benchmark.
Harmony: Harmony exhibits practically the same pattern as Gold Fields except that the range is more neutral - the lows aren't ascending at all - and wider.
Both are trading at the low end of their two year ranges and justify being bought on that alone.
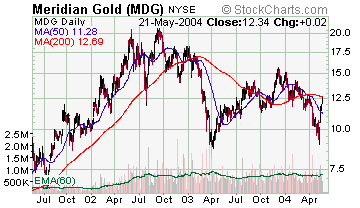 Meridian:
Meridian's shares have been engaged in a bear market like sequence since
2002. However, after meeting the downside objective of the eight month
top (in 2002) by spring the following year bulls have held the line at
US$8 per share since. The stock sat out last year's rally in the sector
but it has been acting well again after releasing the results of its exploration
program in Chile. I'm looking for at least $20 in the short term; maybe
$25 if gold gets to $500 and we get good news on Esquel or El Peńón.
Meridian:
Meridian's shares have been engaged in a bear market like sequence since
2002. However, after meeting the downside objective of the eight month
top (in 2002) by spring the following year bulls have held the line at
US$8 per share since. The stock sat out last year's rally in the sector
but it has been acting well again after releasing the results of its exploration
program in Chile. I'm looking for at least $20 in the short term; maybe
$25 if gold gets to $500 and we get good news on Esquel or El Peńón.
P.O. Box 4642
V.M.P.O.
Vancouver, BC
Canada
V6B 4A1
Phone: 1-604-876-7037