GIC
A Weekly
Outlook and Analysis of the
Global Investment Climate
27 September
2001
Markets have character. Our job is to spot it. Sometimes they are deceptive and sometimes they are very revealing. This is the objective of technical analysis, and it differs with a statistical analysis, which strives precisely to preclude any unscientific interpretation.
Analysts cannot say that one is better than the other at predicting the future course of events. In fact, neither is particularly good at this endeavor. You and I may be, but these tools are just that. We use them in order to help us figure out what to do next. Others use them to try and help you figure out what they want you to. But statistical analysis is particularly difficult to apply to capital markets because few events are like the other.
In fact, the only way they may be similar is in the way the market behaves in their presence.
(this is the) Printer Friendly Version
 |
| What does the positive contango between the Nov '01 / Feb '02 contract mean? |
This Week:
- Where will the V turn up?
- Will there be a bounce in the Dow?
- Crisis management and similar historic events...
- Demand shocks and their impact on oil consumption...
- M. King Hubbert predicts the end to cheap oil, for the world, 45 years ago, and he's been right all along...
- Eddie George, Governor of the Bank of England, on the challenges affecting central banking policy in the new millennium.
The Elusive V
 |
 |
| GDP | S&P 500 Index |
 |
 |
| Crude Light | Dollar |
 |
 |
| CRB | Yields |
Where "will" the V, really be? Note that we didn't include money supply because it is a given, as far as this report goes, that the Fed exists to guarantee all contracts as well as the full employment doctrine. The very obligations created by this credit bubble will also guarantee the wrong kind of inflation (as if there were a right kind), which is inevitable with a lender of last resort that is committed to providing financial markets with permanent liquidity. This is different than in Japan where the Bank of Japan explicitly avoids blatant open market operations, despite pleading from Washington.
Perhaps they have learned from the US experience, which has required increasing policy intervention in order to stabilize the unexpected outcomes. Perhaps they know that there really is no way to sterilize a policy action without precipitating undesirable economic consequences. Sure, they may get deflation, but the alternative is an Inflation Trap.
Perhaps they don't really want to screw the Yen?
Anyway, most bulls might claim that the V will show up in GDP, stock prices, and maybe the US dollar. The modestly bullish would say at least in stocks, if only because they are oversold again. Most bears might say that yields are about to explode, while somewhat fewer would say yields as well as the dollar will turn up in a V-like fashion, due to the prospect of deflation. If you fall into this latter camp then you will likely dispute our contention that money supply growth will resume, as well as our conclusion that the strong dollar policy is going to be the victim of its own undoing.
The Bulls…
Nonetheless, the most bullish of bulls are still singing the praise of
productivity gain, much to the delight of the international banking community.
In a speech by The Rt Hon Sir Edward George, Governor of the Bank of England, at the Centre for financial Studies Seminar, in Frankfurt just this Friday, September 13th, referring to the performance of the US economy he said that:
Briefly - and no doubt over simply - this very strong performance was made possible by developments on the supply side of the US economy in the form of exceptional productivity gains, as the application of new information and communications technologies spread through the economy - Eddie George
Of course the bulls would ignore, as we did for different reasons, his qualification that productivity is extremely difficult to quantify, and settle for the fact that there just has been a significant improvement in productive capacity, end. Yet difficult is the wrong word. It is actually impossible to quantify. And we too may in the final analysis settle that the world has more productive capacity than it used to ten years ago.
Not that that has anything to do with inflation or profit. And of course, economic performance is difficult to quantify as well. However, being bullish does not require mathematical skill, or any skills, for that matter anyways. It just requires (today) that you do not argue with yourself or disagree with others, particularly not bankers, for otherwise, bulls today would necessarily have to dispute Eddie George's bubble popping conclusion about the influence of monetary policy, and consequently, turn bearish:
There is very little that monetary policy can do directly to influence the supply-side capacity of our economies…
Shucks. Then who the heck is going to finance the development of all the wonderful uneconomic technological enhancements / gadgets that go into the calculation of productive capacity? Keep it up guys... you're only fooling yourselves.
The Confuzed
Cheryl Strauss Einhorn, Barron's commodity guru, still doesn't know which
side she's on to be frank. In a recent TV broadcast where she was explaining
the concurrent plunge in oil prices and retreat in gold prices (what retreat?
they are already higher than she expected them to be in her August article,
which we gleefully criticized in Fool's
Gold), on Monday September 24th, she said that the decline in oil
prices portends a weakening of economic demand and possibly forecasts
a recession, but equally, that the retreat in gold prices meant the economy
and stock market were going to recover.
Let me get this straight: weak oil prices forecast recession and gold prices in turn forecast an expansion. Beautiful. How can we get a win-win gig like that?
I stopped reading the Wall Street Journal two years ago, and the Barron's as of now. Bullshit flies everywhere today it appears. The truth is that so many analysts, in particular the blue chip variety, don't know how to read a market at all. They never have. That is because they are accustomed to having it read to them. At any rate, they are of little utility to investors if they aren't even able to be honest with themselves.
The Bears…
As usual the bears are divided. Some even expect a sharp recovery
in stock prices, yields, as well as the dollar. Others expect a further
collapse in stock prices, rising yields, a collapse in the commodities,
and a rise in the dollar.
In case you weren't sure, we're still devoutly bearish. Our position is that global stock markets are unquestionably engrossed in a primary bear trend, and have been ever since we wrote the Point of Recognition last September. In November, less than two months later, Jay Taylor published our forecast for the Dow, which we said would be at 7400 (if my memory serves correct) within 12 months. We are almost there, but not quite.
We're very bullish on yields, specifically the long term ones.
Our forecast for U.S. treasury yields is the 6 to 6.5 percent ranges by yearend. And so far, many of the bears would probably agree with that outlook. But will we go straight to Dow 7000 now, or will the market bounce around meaninglessly for the next two weeks, first, or will the bulls come back fighting? There does not appear to be any real consensus here, and a straight down move would surprise us from this level, and this day, because most of the sentiment indicators have become overly bullish in implication.
What needs to happen for a resumption of the bear market trend, in our view, is that bullish sentiment needs to return. Whether that manifests in a violent swing back toward the 10000 mark or in a sideways trading range is difficult to tell. It is hard to come up with any variable which can support a rally other than one of the many laws of physics, as temporary as they may be. But there is also the very real possibility that panic sets in as well, which it hasn't yet, and the market does sell off immediately.
It is not a cheap market, and regulators have done such a good job at keeping investors hanging on that any break in confidence is easily likely to bring about a panic.
Perhaps all that we can say with any confidence, at this time, is that the Dow 10000 mark will become an insurmountable valuation for years to come, and any rally will be a temporary one. Yet, if it is going to come, now is as good a time as any, according to our read of recent market behavior. That said if it does, look out for the bears that missed the mid month selling opportunity due to any gentlemen's agreements. If it doesn't, look out for the same bears as they become increasingly anxious to liquefy... now if only Strauss Einhorn could hedge like that, no one could take her arguments apart!
Let me put it this way - as investors, we're out of the market and not coming back until it is much lower and everybody else wants out. As traders we are flat and awaiting the right signal (behavior) to get short. As analysts, we're telling you that the long term direction is down, and the short term direction is still up in the air - pending further developments, market related or otherwise.
Parting Ways...
Where we part with many other bears, in our capital market prognosis,
is that we are anticipating the Fed to continue to be easier than the
market requires it to be, which should favor a dollar devaluation and
concurrent reversal in the commodity indexes at this juncture. We
do expect a vicious stock market rally once our Dow objective has been
reached. The leaders will be the oil, gold, and commodity related stock
sectors, and what will drive them will be the dollar and monetary inflation
of the new millennium. We're betting too that everyone else at that point
will be expecting the Dow to go to 5000.
But our analysis of the commodities sectors seems to be lacking. We expected a bottom to develop in the CRB index this summer (at about 200) which would accompany, follow, or precipitate a stock market and dollar decline. Steven Saville noted in an email to me in August that he felt this bounce would not occur until October or January, primarily because there is typically a six-month lag between the bottom in bond yields and a reversal in commodities.
He appears to be correct so far, but I would caution that the terrorist attack had a more direct impact on the CRB then it did on equity markets. The commodity indexes are in the midst of an intermediate decline as is the stock market, but they are also arguably in the middle of a primary bull market, in our view, unlike the stock market. While our forecast for a reversal in the CRB appears to have been early, it stands, and we stand behind our view that the energy, gold, as well as the grains, will lead it.
 |
 |
| CRB Commodity Index | Goldman Sachs Commodity total return |
Crisis Management
"Learn from history prepare for the future," was the subtitle of
a recent report by Standard and Poor's corporation called World
Crisis and the Stock Market. This is the second statistically
derived analysis on stock market volatility that I've seen in a week.
It is amazing to consider how much can be done while the markets are closed for four trading days. Incidentally, the objective of reports like this, particularly from institutions associated with the major stock market exchanges or the banks, can be nothing short of neutralizing panic. On the small venture capital exchanges, stocks are frequently halted for news pending. The reason that is offered is to allow for proper dissemination of the news, whether it is good or bad, since certain news can dramatically alter the market capitalization of a company that has few assets but lots of hope.
However, and without getting on too much of a tangent here, this is another example of well intentioned but poorly constructed regulation, or intervention. They say it is unfair that some people get material news before others do, so this is their way of leveling the playing field. However, they've interfered with a market process, and weakened it by doing so. How? Consider how efficient the news dissemination business might get were it not for a policy which protects the slow pokes!
This is patently stupid. Maybe academics should not be allowed in this market at all, at least not until they've traded it for several years... I mean really traded it, not just having an account for some stockbroker to abuse.
Anyway, Jason Zweig, a reporter for the CNN Financial Network, wrote the other, more colorful article: (http://cnnfn.cnn.com/2001/09/21/investing/zweig/).
He neatly summarized the other major events of this century that came anywhere near the market impact of the September 11 catastrophe - ranging from Pearl Harbor to the Korean War to the Gulf War. There were eight altogether, and since the idea of the article was to get bullish then we could assume these were the best choices also.
The table below is from the article.
The weighted mean of the Dow's initial reaction to each event was a decline of -6%, which could have meant right away or maybe days or even weeks; but it was up 6.5% a month later, +8.4% in three months, and after six months had passed, the average gain on the Dow was +10.2%... presumably relative to the pre event level.
Those are pretty bullish numbers, and well above (long term) average variations. That means that besides the bullish implications of mass murder, surprise, or genocide, these exogenous events typically bring about more volatility than usual. Only in three of the instances was the Dow lower in 6 months than it was AFTER the first reaction. But that's 38% of the time, which implies that even mass murder is not a sure thing for the bulls.
Nevertheless, were we to blindly apply this model to the Dow, starting at 9700 (Sep 7), the inference would be an initial move to 9100. Oops, we've already passed that though. What now? If we take the one other instance (the bombing of Cambodia) where the Dow suffered equal damage then instead of 10690, the inference would be a bounce all the way up to 11640.
Pretty bullish stuff! One way to read that then is the more that one event initially affects the market, the harder it (the market) should bounce back. The law of physics comes to mind, that every action has an equal and opposite reaction. Well, at least that's what statistics presented this way are supposed to invoke, these very thoughts coming to mind, that is... the harder they fall, the harder they bounce. Manipulators always start out with good intentions (or at least not as bad as the ones that they end up with).
At any rate, consider that XYZ stock is trading at 12 times earnings. It's an old technology stock in a boring end of the business. But the company gets on a roll, and earnings start to rise. Investors initially expand (bid up) the multiple (P/E) to 14, 15, then 20 times earnings because the company just announced that it was changing its business plan and going after some higher growth prospects as well. This isn't talk, or rhetoric, it's true, and it is showing in the bottom line.
This stock may have been Microsoft before the Gulf War or it may have been one of a dozen other Giants today that started in the boring technology business 10 years ago.
So the stock soars from $8 to $120 over the next ten years. Meanwhile investors are frantically driving up the share multiple well ahead of any fundamentals, to maybe about 40 times earnings. Few companies can fulfill such expectations, let alone the kind that come with multiples three times that high, and so the stock finally goes into secular decline. Maybe there is a catalyst, maybe there isn't. Sometimes the decline moves ahead of the fundamentals, as was the case to the upside. At other times, the decline affects the fundamentals, as was also the case to the upside. And yet, at other times, it lags the fundamentals, though this is rare and usually only occurs at primary reversals.
In any case, sometime near the peak of the company's ability to expand its business further (materially) the secular bear market will set in. And once the bear market begins, it's all about an erosion of confidence in the same manner that the preceding bull market was all about the inflation of confidence.
Now, how could you apply any statistics the same way to an index comprised of stocks in the beginning stages of this cycle as you could if they were at the end of this cycle? Would the Gulf War (the one fought in 1991 in the M.E.) have had the same impact on stock prices if it happened today, as it did in 1990/91? Not likely.
While the fundamentals are clicking and the stock market is relatively cheap, the impact has got to be far different than when the fundamentals aren't clicking and stocks are expensive, AND while the market is arguably just beginning a long term decline.
According to Zweig, the author of this particular article:
An investor who bought U.S. blue chips just after Pearl Harbor and held them just until the end of 1945 would have earned more than 25% annually, according to researcher Ibbotson Associates of Chicago.
Cripes, that just happened to be one of the cheapest markets to buy this entire century. Too bad there wasn't a crisis like this in the fall of 1929 to add to the data. There were plenty of them in the seventies, but the author conveniently discounts them as having been caused by the ravages of inflation rather than war. If only he knew that it is exactly inflation which creates bull markets, as well as bear markets when it breaks down. Maybe, in a decade, market historians will discount this act of terrorism as secondary to the true character of the markets as well... in which case it will be excluded from the data... but only if the market does not bounce back right away.
If all this business came down to was statistics, you wouldn't need us. All you'd need is a computer, but we know that no amount of technology or information is of use to anyone who doesn't know how to use it.
Had there been a war that suddenly broke out and that involved the United States in the summer of 1929, just before the big crash, then we could have blamed the crash on that event, and it would have been really difficult to blame it on anything else. Subsequently, this author could then tell us that the initial reaction was a -23% and that 6 months later it was still substantially lower, and that it took another 15 years to break even.
But we know darn well the author would not blame the crash on the war, for it would skew his bullish conclusion. At any rate, he cogently points out (yay!) that according to the Israeli experience, "the traumatic toll exacted by terrorism does not necessarily extend to the financial markets." We agree with that observation.
These kinds of events themselves have no direct effect on the true (already determined) course of stock prices, and especially do not herald market reversals as our bullish author not so subtly infers. They perhaps have an immediate psychological impact, and require indirect consideration as to their dislocative effects on economic variables.
But consider that the same event which might have hypothetically taken blame for the crash of '29 may have had only a slight effect in 1920.
Both of the articles observed a series of exogenous events that occurred this century, which were as catastrophic an influence on stock prices as this event "promised" to be. But promised is the key word, for none of those prior instances had anywhere near the degree of crisis management that was apparent in the days following September 11.
The networks, regulators, government, and Wall Street were all doing their best to inform investors about the potentially bullish implications of these other historic events.
The four-day trading halt this time around was unprecedented too and it is well known that Roosevelt's bank holiday was successful in curing that panic.
Will it work to cure the current (potential) panic? Yes, but it should also preclude the rally that history reveals to result from the benefit of surprise.
Thus, to the extent that crisis management offsets a market decline it must also neutralize the implied reversal, since such a reversal can only be explained by loosely applying the laws of physics to market movements in the first place: for every action there is an equal and opposite reaction. In other words, softening the initial action should reduce the magnitude of the subsequent reaction. Wouldn't you agree? So now we can say that to the extent that the regulators have been effective, both the panic and subsequent rally ought to have smaller amplitude, and therefore, we should forget about this analysis altogether and discuss the market seriously.
Regardless how much stock the corporations tell you that they have planned on buying, if you won't buy that stock from them at a later date, they will sell it to raise money, particularly if yields rise as we think they will. Moreover, there hasn't been a selling climax yet, and any build up of pessimism is likely to represent professional hedges in the options and futures markets. The fact is that there is no shortage of stock today, and particularly no shortage of expensive stocks. Moreover, there is an abundance of pent up supply. Of course, the first place to look for the elusive V is where there is pent up demand, not supply, where there exist the prospect for supply shortages, and where a weak dollar will most likely play havoc with prices and the market mechanism.
Source: Energy Information Administration
Oil is a good place to start because the US is increasingly import-dependent on, and chronically under supplied in it. What's more, it is increasingly finite as well. Colin J Campbell and Jean H. Laherre (1) reckon 90% of the world's crude oil has already been found. This conclusion observes as well as explains the fact that discovery rates have been declining since the seventies. To illustrate this, they show that global oil reserves have been falling despite government data, which show them to be rising.
Pointing to the graph below they say:
Growth in oil reserves since 1980 is an illusion caused by belated corrections to oil field estimates. Backdating the revisions to the year in which the fields were discovered reveals that reserves have been falling because of a steady decline in newfound oil (blue).
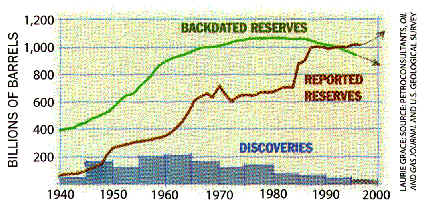
And, drumroll please... it is precisely this illusion that the Energy Information Association bases its own forecasts for global oil production upon, and why it sees production rates growing by more than 50% right through to 2020, unhindered. To be sure, were we to extrapolate the current trend in annual world oil production, never mind reserves, the conclusion would also validate the EIA's forecasts of plentiful future oil supply.
It is true that production data is more reliable than global reserves data, since the latter involves layers of estimates, and buried underneath that is always a political agenda.
However, it is also true that the rate of production is constrained by whatever the true level of global reserves actually is. Thus, if global oil reserves are falling, rather than rising as the EIA suggests, then what explains the rising production rates?
Where is M. King Hubbert
(2)?
According to M. King Hubbert, the rate of production, either from an individual
well or a region, should rise until when about half the oil is gone. After
that, production rates begin to taper off, gradually falling back towards
zero.
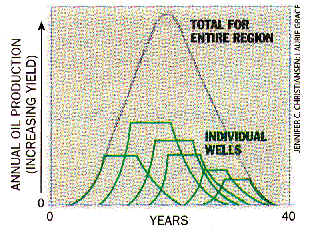 |
FLOW OF OIL starts to fall from any large region when about half the crude is gone. Adding the output of fields of various sizes and ages (green curves above) usually yields a bell-shaped production curve for the region as a whole. M. King Hubbert, a geologist with Shell Oil, exploited this fact in 1956 to predict correctly that oil from the lower 48 American states would peak around 1969. |
Indeed, the rate of production has been declining in North America since 1972. It peaked in the former Soviet Union in 1987, and it is arguably peaking in Norway and in the UK as we consider this. Notice in the chart below that the Hubbert model has predicted a peak this year, and notice in the chart below it, that production rates in the UK have indeed been declining, while in Norway they have become flat.
This is a clear departure from the steadily rising trend in production rates between 1980 and 1998, from these two regions.
Even in the Persian Gulf states production rates may have seen their best days (see prior chart above). During the late eighties, authors Campbell and Laherre observed that six of the 11 OPEC nations raised their reported levels of oil reserves by anywhere from 42 to 197 percent without corresponding oil discoveries.
They believe that while the announcement reflects a reclassification of "prospective" oil reserves from a conservative figure to one more realistic, they also observed that since the oil industry was nationalized, in the Middle East, governments there have consistently reported optimistic estimates, so as to maximize their respective export quotas.
Thus, they're only depleting their reserves faster than they were allowed to prior to that adjustment, but they are certainly not producing at rates that would accompany the growth in reserves they claim to have in their backyard. There should be nothing stopping them, especially considering that both oil demand and prices are at, above, or near, 20-year highs. But there is. M. King Hubbert. We don't know what the precise state of affairs is in the Persian Gulf countries, but we can tell that production rates should be much higher in light of these circumstances, and in light of the fact that the reported rise in these reserves is more than all the oil ever discovered in the US, plus 40%.
According to Campbell and Laherre's application of the Hubbert model, global oil production should peak sometime this decade. Their conclusion is not that the world is running out of oil, but that it is running out of cheap and abundant oil.
They made this conclusion public in March 1998, less than a year before oil prices bottomed out at about $11 bbl.
The switch from growth to decline in oil production will thus almost certainly create economic and political tension. Unless alternatives to crude oil quickly prove themselves, the market share of the OPEC states in the Middle East will rise rapidly. Within two years, these nations' share of the global oil business will pass 30 percent, nearing the level reached during the oil-price shocks of the 1970's. By 2010 their share will quite probably hit 50% - Colin Campbell / Jean Laherre
This was written over three years ago. Today, OPEC's share is near 40%, and there is unquestionably an abundance of economic and political tension on the subject of oil. By the process of induction, therefore, could we presume that we are near the peak as per Hubbert? There has been a lot of talk about OPEC's complicity in encouraging high priced oil when the evidence suggests that they have been only to happy to accommodate the higher demand with more production, not less. They have not lagged the world in raising production, they have led it… but they have been lagging their giant reserve claims.
| Crude
Oil production from various regions of the world: Jan 1999 to May 2001 |
|
 |
Some analysts believe that without OPEC, there would be no end to cheap oil, but they don't seem to mind the FRB, which will all but guarantee dear oil. Furthermore, note that the UK, the United States (even with the "stripper well" phenomenon), and many non-OPEC nations have been even less accommodative to the explosion in world crude oil demand that two years ago wasn't even acknowledged. Recall the New Economy!?! |
The unfolding data suggests not only that the Hubbert analysis is likely going to be right, but it also explains who else is gaining market share: Russia, China, and also Canada, marginal though it may be.
Still, the marginal oil supply produced in China is easily absorbed, and therefore does not quite explain why oil prices have gotten clobbered this past week.
Has the outlook for world oil supply changed? Has there been some massive discovery of oil that we aren't aware of? I hope not. I hate missing a good exploration play.
Demand Shocks
Now there's some New Economy thought. To us, these shocks are undeniably
the result of a poorly run Fiat monetary experiment.
According to Platts, an economic consultancy in Kuwait:
The "timing" of such a terrorist incident couldn't have been worse, said al-Shall Economic Consultants in their latest published weekly report. "With poor world economic performance, oil will be under pressure on production and price."
Below is a chart we've assembled with data from the Energy Information Association, depicting the trend in US annual petroleum consumption. The data does not include natural gas, gasoline, or electricity consumption.
The shaded areas in the chart refer to those periods when demand had apparently declined. It would make sense to presume that since those were qualified recessions that demand would have receded. Yet note in the chart below, that each apparent demand shock was accompanied by rapidly rising oil prices, implying that production bottlenecks were a larger part of the problem than Wall Street would admit, and may have even precipitated the onslaught of recession.
In fact, the 1974/75 "demand" shock followed the peak and subsequent decline in US oil production in 1972, as per the Hubbert model, while the 1979/1983 "demand" shock followed a plateau in M.E. oil production (see chart). While consumption peaked in 1979, the rate of production in those countries plateau'd shortly after the 1974/75 recession.
Certainly the recessions helped to soften demand but not nearly as much as the high price of oil did, perhaps. Indeed, consumption of oil began to increase again as soon as prices began their long-term decline in 1982, and did not look back except for the effect on demand that the price shocks of 1990/91 had.
Certainly, the EIA has been forecasting slower consumption, but their case would be much stronger if they were basing it on the price shock of 1999/2000 rather than on the perception of slower economic growth resulting from declining stock prices. One of the differences between the outcome of the 1974/75 economic recession, on oil prices, and the outcome of the 1981/83 recession, is that Fed Policy fanned the former price rise, and Fed Policy reined the latter price rise in.
Recall that Arthur Burns had the pedal to the metal, trying to pull the economy out of recession, while Paul Volcker's job was to inspire deflation. The subsequent rise in the dollar, already softening economy, and vast malinvestment in the oil business did much more damage to the price of oil than did a declining stock market.
Today, as Merrill Lynch's global oils team observes, the industry has just experienced a 19-year contraction. And Hubbert predicts that this contraction can only be offset with higher prices. Bugos predicts, much, much higher prices.
The drop in consumption during 1990/91 was the result of a supply shock to production that resulted from the Kuwaiti fires and the seizure of many other wells in the region. What makes us so sure that it wasn't a demand shock? Because the price of oil went to $40. It was a demand shock; only it was caused by price.
So having explained the important declines in US oil consumption, let's consider how oil prices respond to declining stock prices. In the summer of 1990, the DJIA traded at 3000 then Iraq invaded Kuwait, and the average fell to just above 2300, nearly a 20% decline. Oil prices did not decline, because they were part of the catalyst for the stock market debacle. Between 1997 and 2000, the Dow fell by more than 10% 4 times, and none of the declines had anything much to do with the oil in the Middle East.
January 1997 - September
2000
In one instance (1997) oil prices went off to new lows. In the second instance (1998) a new low was made but it was shortly followed by a primary reversal. In the latter two cases, oil prices received their demand shock only to make higher highs. If this stock market decline caused a demand shock to the oil market like the one that Wall Street is predicting then it would not be a common occurence.
In the 3rd quarter, 1997, as a consequence of the first broad Asian monetary crisis (originally brought on by the strong dollar policy in our opinion), the DJIA fell by almost 15%. Although this had little impact on the consumption of oil in the United States, oil prices subsequently fell to $12 by the summer of '98, from about $22, the high reached on a spike in response to the initial decline in the dollar.
But the dollar recovered strongly, and production from Norway, the UK, and from the M.E. in particular, flooded the market, perhaps in exchange for dollar assets as the US was increasingly perceived to be an Island of Prosperity, as Greenspan called it then. Furthermore, perhaps due to the inflation of oil prices relative to their own currencies, which were subjugated to the strong dollar, Asian demand collapsed also.
 But
the Dow decline did not cause the decline in Asian oil consumption, and
it did not cause any decline in Western oil consumption. In the summer
of 1998, there was a level of complacency about the state of the global
financial environment that I had not seen again since this summer had
passed. The Dow actually drifted to new highs just before it got clobbered
with bad news from Russia and more bad news from the Asian economies.
It subsequently declined by a little more than 20%.
But
the Dow decline did not cause the decline in Asian oil consumption, and
it did not cause any decline in Western oil consumption. In the summer
of 1998, there was a level of complacency about the state of the global
financial environment that I had not seen again since this summer had
passed. The Dow actually drifted to new highs just before it got clobbered
with bad news from Russia and more bad news from the Asian economies.
It subsequently declined by a little more than 20%.
But this time, while oil prices did in fact respond the same way - rising first, making a new low next - declining from a crisis peak of $16 to $11 by December 1998, they were about to turn around big. The Dow did recover quickly and it can be argued that the rally in stock prices helped to subsequently boost demand as well as the price of oil, but the fact is that global consumption never did decline; indeed, it was probably egged on by the cheap price of oil.
The reversal in early 1999 was the direct result of an overly easy Fed policy, a "contracting" oil industry, declining stockpiles of crude oil inventories in the West, and a perpetually rising global consumption of cheap, maybe even subsidized, oil. Granted, part of that is financed through the wealth effect, but probably only a small part.
Note the initial impact on, and subsequent resumption of trend, in oil prices after the 10% Dow declines in October 1999, and the first quarter of 2000. While consumption has not materially slowed, prices have declined enough to stimulate fresh demand.
Still, it is true that while none of the previous Dow declines foretold recession, this one may. But it is equally true that last year's oil price shocks have similarly foretold a recession. Whether that means the kind of recession that will reduce demand beyond the will of nations to produce oil will depend on the nature of Fed policy, the state of the dollar, and the development of alternative energy sources.
The latter is a long way off, at least a decade. In the meantime, massive corrections need to occur in the oil industry itself (this process requires high prices) as well as in the dollar and US economy. A 1979/83-style recession is bearish for Oil prices but that isn't where we are today. To get there, the world must again experience the kind of inflation that causes over investment in the oil industry.
The fact that OPEC economists are always worried about demand is moot. The only reason they cry about shortfalls in demand is to justify further cuts in production.
Mark Kellstrom, a private/independent oil & gas analyst who had referred me to the article by Scientific American is bullish on oil. He says that because oil is money, it will always be in competition with the inflation-racked dollar, to some degree, as an alternative store of wealth, but he says also that this particular concept is extremely difficult for investors to grasp. Not for Goldenbar readers it isn't.
He also points to declining "reported" world crude inventories, particularly in nations that are heavy net importers, as having precipitated the reversal in crude prices in 1999. Clearly, he is right.
Indeed, Merrill Lynch is quite bullish on oil as well. According to their Global Oil Team in a report last week:
Merrill Lynch's positive oil theme has been based on 20 years of industry contraction and under-investment. This has put OPEC in firm control of the supply/demand balance, i.e. it controls the marginal supply barrel to meet demand growth.
They are saying that OPEC has become an increasingly crucial source of crude oil for the US, and the world… just as authors Campbell and Laherre predicted, with the Hubbert model. And that strikes another chord that was highlighted by Mr. Kellstrom in response to my questions: that oil is a terrific wartime asset. If so, it is surely trading at a discount.
According to Independent.co.UK, September 23rd, 2001:
The global oils team at Merrill Lynch believes that the situation throughout the world now closely resembles that of the oil shock-littered Seventies, with three major areas of similarity. The first is that oil producers outside Opec are generating only a lackluster supply. Many assumed that high oil prices would encourage non-Opec countries to boost output, but the evidence suggests otherwise. The problem is, in large part, fallout from the past 19 years of a down cycle. Despite the attraction of high prices, the oil industry has been left without the staff or investment opportunities to aggressively boost production. The second is that Opec is now in the strongest position for decades to control the oil price by using its stranglehold on the supply/demand balance. Opec has an ideal price band, and even with a worldwide slump in demand, the producers are normally expected to keep crude prices within that. The third feature is a return to Seventies levels of military and political volatility. The relative calm in the region before the attacks has now given way to an era that will likely be marked with sudden and unpredictable supply shocks, say the analysts.
Against such a backdrop, it is hard to reason for the days of cheap oil.
Banker George
Besides using his speech to offer public support for the Fed's productivity
argument and to lower our expectations in regard to the effectiveness
of monetary policy, the goal of his speech was to discuss some of the
challenges confronting central banks in the US, Europe, Japan, and the
UK in particular, looking forward. Starting
with the admission that monetary policy is more effective on the demand
side of the economy, and the inference that is where it should focus,
Eddie George explained that:
For a start we cannot directly observe or measure what is happening in an underlying sense on the supply side with any great precision - Eddie George
What he is saying is that it is hard enough to guess at where the economy is, on the supply curve, let alone try to influence the supply side.
But truthfully, he assiduously skirted a trap. For if he admits that monetary policy can influence the supply side of the economy, a whole new question arises: how much control does central banking policy really have over the economy? Lots.
Indeed, if the explosion in monetary aggregates, which led to or resulted from, the inflation in asset prices during the late nineties, had anything to do with demand, it also had to do with supply. Say's Law says it is so, but we don't even need to reference Say. Who can deny that the stock market bubble influenced capital investment decisions? Not Mr. George, who said that productivity enhancements, in the US only I presume, resulted in the promise of a higher sustainable rate of growth in the US economy, and profits.
That expectation in turn contributed to a rapid rise in equity prices, especially in the "high tech" sectors, which helped stimulate both business investment in the US and consumer demand causing the private sector to move into financial deficit. It also attracted massive direct and portfolio investment inflows from abroad, which over-financed an increasing current account deficit in the US and caused the dollar to strengthen against other currencies - Eddie George
- he could have just referenced the goldenbar report, were it not for the implicit denial that monetary policy could have had anything to do with the equity bubble, because it cannot affect the supply side of the economy, remember? Certainly (and which is also one of the challenges of monetary policy) central banks take asset prices into account:
But insofar as we cannot influence them directly we have to be satisfied with seeking to offset their effects on demand and inflation through other channels of the transmission mechanism - Eddie George
Offset, huh? He knows darn well that they can and do influence asset prices; in fact, central banks are probably more effective in influencing asset prices than they are at the economy insofar as the demand for credit can depend on the inflation of asset prices.
Finally, and something that is very important, Mr. George said that:
What all this means, in turn, is that the most monetary authorities can hope to achieve is to maintain overall macro-economic stability; we cannot pretend that this means stable conditions for every sector of the economy, still less every individual producer - Eddie George
This admission is a coup for Mises and the Austrian community, I think, to the extent that it is a subtle departure from Keynesian inferences on aggregate demand. He applies this to the overall currency arrangement by concluding that:
But I am confident that persisting in our parallel attempts to maintain macro-economic stability in our respective currency areas provides the best way forward for the world economy as a whole. But it may be a somewhat bumpy road - Eddie George
What he is saying is that central banks should focus on stabilizing their own macro-economic environments, irrespective that the process engenders sectoral imbalances within the economy. If each nation pursued such a policy, he says, the result would be a stable global monetary environment. Yet that is precisely what is wrong with the global economy in the first place. For one, what is the volatility in oil prices, asset prices, and foreign currencies if not the consequence of (cumulative) sectoral imbalances?
Consequently, absolute stability has never been done, and never will unless the gold standard is freed. What is the cost of trying to stabilize this unfeasible Fiat monetary experiment? The next sector, or entire economy, that will bear the sacrifice.
CONCLUSIONs
Oil markets are about as strong a buy as The Goldenbar Report can issue. The longer the stock market waits to rally, on the other hand, the less optimistic we are that it will. But, there is a way to make money hedging this scenario, if we are correct about a rally in oil prices that is. If the Dow rallies, oil (and gold) shares have been the leadership, and should get impetus from the rising price of oil. If the Dow does not rally, it is still likely wise to own oil shares as a countertrend sector. Can one sector go up while the rest go down? Sure it can, this is how the market has indeed operated for three years now.
The potential for a sustainable demand shock to affect the price of oil is low on the probability scale compared with the effect from potential supply problems in both the short and long term. The primary reason for this lays in the primary difference between today and 1983. In 1983, the industry completed a long expansive phase that saw oil shares absorb 20% (my memory may be conservative here) of the capitalization of major stock market averages. Today it rests on the other end of that rainbow.
Central Banking policy today seems intent on stabilizing the macro economic environment, but in the process is responsible for wicked sectoral and regional imbalances. Where ever the next imbalance shows up... that is where we'll find our V!
Sincerely,
Edmond J. Bugos
- Campbell and Laherre have each worked in the oil industry for more than 40 years, and are the authors of "The End of Cheap Oil," Scientific American, March 1998. Here is the paragraph we are referring to in this section: "It is important to realize that spending more money on oil exploration will not change this situation. After the price of crude hit all-time highs in the early 1980's, explorers developed new technology for finding and recovering oil, and they scoured the world for new fields. They found few: the discovery rate continued its decline uninterrupted. There is only so much crude oil in the world, and the industry has found about 90 percent of it."
- M. King Hubbert was a geologist with Shell Oil, who is credited with predicting, in 1956, that the oil produced from the lower 48 American states would peak around 1969… meaning production rates. The theory was based upon the geological fact that yields, or production rates, peak at about where half of the oil in a well (or region) is gone. "Beyond this point, production rates do fall, and from an economic perspective, when the world runs completely out of oil is thus not directly relevant: what matters is when production begins to taper off. Unless demand also declines commensurately, prices will increase" Hubbert observed that in any large region, unrestrained extraction of a finite resource rises along a bellshaped curve that peaks when about half the resource is gone. To demonstrate his theory, Hubbert fitted a bell curve to production statistics and projected that crude oil production in the lower 48 U.S. states would rise for 13 more years, then crest in 1969, give or take a year. He was right: production peaked in 1970 and has continued to follow Hubbert curves with only minor deviations. The curve fits several producing regions in the world. (The End of Cheap Oil; by Colin J Campbell and Jean H Laherre, Scientific American, March 1998).
The GoldenBar Global Investment Climate is not a registered advisory service and does not give investment advice. Our comments are an expression of opinion only and should not be construed in any manner whatsoever as recommendations to buy or sell a stock, option, future, bond, commodity or any other financial instrument at any time. While we believe our statements to be true, they always depend on the reliability of our own credible sources. Of course, we recommend that you consult with a qualified investment advisor, one licensed by appropriate regulatory agencies in your legal jurisdiction, before making any investment decisions, and barring that, we encourage you toconfirm the facts on your own before making important investment commitments.