Weekly Gold Markets
Bullish Facts Abound, 2nd Half Rally
28 May 2005
A gold & currency digest
By Ed Bugos
| Print Copy | ||
| Today's Highlights: | ||
| 3 technical scenarios for the HUI, at least |  |
|
| Bullish case for gold must be factored, first | ||
| South African gold shares bounce back on firmer Rand POG | ||
| Gold share valuations back in line with POG | ||
| Bullish COT's, the long and short of it | ||
| 16 bullish short term facts for the gold sector, 3 bearish possibilities | ||
"This is how liberty is lost, in a blaze of applause" - Padmé Naberrie, Queen Amidala, from Star Wars' new Episode III Revenge of the Sith
-----------------------------------------------
The current bounce off the 165 low in the HUI should be a no-brainer; the more difficult question is to determine whether it is just a bounce, like the brief one in February/March, or the beginning of something more bullish, like the August-November 2004 rally, or perhaps something even bigger?
The HUI (AMEX Gold Bugs) chart is the most bearish of the gold stock index charts because the 2nd quarter decline ended almost right at last May’s low, which brings into focus the possibility of a horizontal neckline, and a nearly 2-year descending triangle.
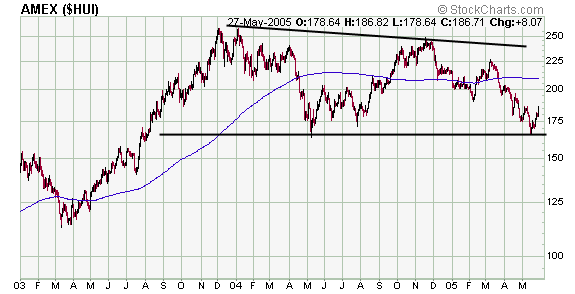
If it is a descending triangle the current bounce has legs to the 200-day moving average at around 210 plus or minus, after which it could fall back to the May low, bounce around there for a bit, then head off to 110 – unless it is a bear trap in which case it would penetrate the neckline at about 160 briefly before turning up again.
The other indexes either put in a higher low (relative to the May 2004 low) or a lower one – both of which can be interpreted bullishly. A higher low (as in the case of the TSE Venture index, CBOE, and even the XAU) is less bearish for obvious reasons while a lower low (as in the case of the TSE senior gold index and the SA share index) rules out a topping formation in favor of a normal intermediate correction.
If, for instance, the HUI made a lower low on this latest decline instead of stopping at the May low it could not really qualify as a top. In any event, there is a positive inference that can be drawn even in the case of the HUI chart: the recent low was five points above the May 2004 low, making it a higher low… technically speaking.
Most skeptics and cynics will say: five points is nothing in the scheme of things.
That’s true – normally such a small variation wouldn’t stop me from drawing a straight line across the entire length of the consolidation connecting the May 2004 bottom to the May 2005 bottom as in the graph above.
However, it is worth noting that the November high came in only 10 points short of the late 2003 high, which is also a relatively small variation.
Thus if we are to ignore the small variation at the low end of the consolidation we should also ignore this one at the high end – in which case we’d have to draw a straight line up there too, which in turn would rule out the descending triangle hypothesis in favor of a straightforward but more neutral rectangular trading range. On the other hand, if we do not ignore either variation we would have to perceive a neutral triangle formation that is more symmetrical than the one I originally assumed back in March/April.
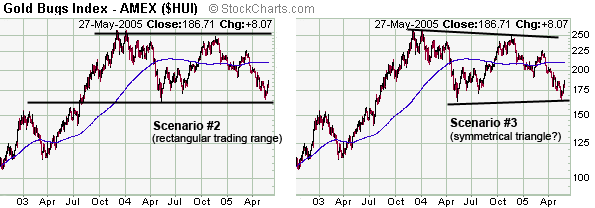
…albeit, the triangle has very gentle slopes. This is quite possibly the case nevertheless – and it doesn’t involve a bear trap; a bear trap would necessitate a lower low that looks like a break down. So far we’ve seen no break down in the averages or in gold prices.
Notwithstanding that fact, the geniuses are increasingly convinced that the gold run is over. For the record, usually these are the people that missed the run, or at best came in late. I do not deny the possibility of a sharper correction in gold prices or gold shares – meaning a 30% decline in the gold price and a 50 percent plus decline in the gold stock “averages” from the highs – half of which has already occurred.
However, I do rule out the nearby possibility of deflation (separate article coming after this one) as well as the possibility that a primary liquidation may get underway now, prior to a convincing run to the upside. Gold has risen in a steady trend since 2001. It has outperformed the main US share averages as well as bonds. But, as you know, it has underperformed most of the key commodity markets as well as real estate.
These are not sustainable facts in the context of a gold bull market – in which gold is the best performer, by definition.
Bullish Case must be Factored,
First!
The markets are focused on foreign exchange fluctuations, the growth in
Chinese final demand, as well as the apparently competing aggregate demand
from an alleged global economic recovery. In fact, analysts even tend
to point to the bullish effects of the new commodity based investment
products (i.e. trust and paper securities) before acknowledging
the effects of monetary expansions (around the world), the resultant loss
in the purchasing power (and confidence) of paper currencies, and the
US dollar’s fall as a reserve currency. It is this observation
mainly that keeps me bullish on gold prices, and by extension, on gold
shares in the short term… and why I am holding out for that buying
climax which is a typical end for commodity advances.
I do not believe that the market has even partially factored the bullish case for gold, which is basically the premise that the forces of inflation have overwhelmed the forces of productivity; and that at the margin, any further expansions in money and credit are more likely to result in a confidence erosion in the Fed’s notes than in a PE ratio expansion, lower interest rates, or a strong currency (some analysts believe that an aggressive inflation policy is bullish for the foreign exchange value of the currency – they call it “quantitative easing”). The bullish case for gold has little to do with foreign exchange rates in the long run even though that is what everyone seems to be focused on in the short term – partly reflecting their confidence in the Fed (and other central banks), that “inflation is under control.” Few people even know what that really means.
So if the trend in commodity prices fundamentally reflects monetary factors, as we suggest it does, and which in fact was the primary reason we called for the bull market in commodities to begin with (earlier than most anal-ists I might like to add), then gold is about to rack up another US$100 (plus) rally with or without further declines in the foreign exchange value of the US dollar – reflecting a real devaluation – and as discussed in the last issue it is characteristic of gold bull legs to end in a glorious explosion relative to all the currencies simultaneously… in other words, again, whether the US dollar index rises or falls gold prices are set to rise sharply.
If most people were running around worrying about inflation, then 1) the stock market averages would not be trading at a 20 times PE ratio, 2) bond yields would be markedly higher, and 3) I would be looking for a top rather than betting on a buying climax.
At the moment, inflation expectations, while steadfastly on the rise, are confined to a relatively small proportion of the market. This cannot be disputed at current stock/bond valuations. If we got our move to the upside, a 30 percent correction in gold prices would be more plausible than it is from the current level. Anything is possible.
 My
main premises (monetary) could be wrong and gold prices might be on their
way to the low US$300 area… robbing us of the vindication that should
be ours if our premises are correct.
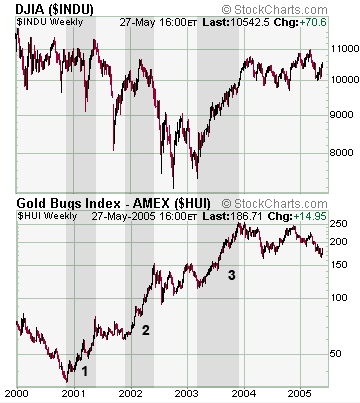
In any event, besides drawing a positive inference from the technicals as well as sentiment (not just the lack of bullish sentiment but also the fact that participants are focused on the wrong drivers), I also have yet another bullish observation to communicate regarding the relationship between gold stocks and the Dow. Gold stocks are usually counter-cyclical assets.
This means that they tend to rise when the Dow falls, and vice versa. This is historically very apparent, and even in the current cycle it was evident up until 2003 when the correlation turned positive (I argued then that this was due to the market’s general lack of confidence in the substance of the Dow’s comeback – and indeed one could argue that the current weakness in the gold shares partly reflects increasing confidence in the substance of the Dow’s comeback).
At any rate, in a report during 2003 I went back to the 1962-80 gold share bull market in order to gauge this correlation during bull market periods, and found that as the bull market progressed the inverse correlation (between gold shares and the Dow or S&P 500, etc.) became stronger… i.e. that it was weak during the sixties but by the late seventies it became strong. My hypothesis was that it became psychologically ingrained.
Clearly, the current generation is not likely to have this relationship fully ingrained, especially not if most of the public is still bullish on the main stock market averages. Many investors are now looking at the gold sector in terms of a REFLATION trade, meaning that the cost of stimulating the economy by monetary policy is higher gold prices but not necessarily a gold bull market in the counter-cyclical sense.
This could be the result of the positive correlation rather than the cause of it.
In any event, the bullish inference in all of this is the fact that the gold shares have decoupled from the Dow over the past 12 months or so, and the sector has been one of the weakest in the market… especially since November. I realize that, as already mentioned, the (correct) inverse correlation is probably still weak because the bull market is quite young. However, the decoupling is another bullish factor for the gold sector to the extent that it marks the return of the counter-cyclical correlation.
…That is, provided you are as bearish on the main averages as we are.
For as I said last issue the one way our outlook is fundamentally wrong is if the economic recovery has more substance than we estimate. In this case, the counter-cyclical relation may have returned but it would mean the Dow goes up and gold stocks down.
My gut says that what we’re seeing in the gold shares right now is something akin to the way that a tide gets sucked out just before the tsunami hits the shore.
The Dow might wobble higher yet and I’m not sure if the gold share tide has more to ebb; but nonetheless, I do believe we are approaching an important inflection point that will convince the world (and the Fed) that the gold bull market has finally arrived.
Either way, the likelihood is strong that the gold shares will rally enough to make trading profits in the short term; and if the averages (especially the HUI and XAU) break out over their November highs, look for another 50% or so move – in other words, on the break out to new highs in the HUI, my target for that average would be somewhere between 300 (worst case) and 400 (best case). The best case implies a double from here. The frustrating part of the ride may indeed be about to come to a close.
South Africans Bounce Back on Firmer
Rand POG
But the silver shares rallied hardest. Our silver index was up 12.2% last
week pushing the HUI up by just about nine percent. Generally, the midcaps
were the best performers.
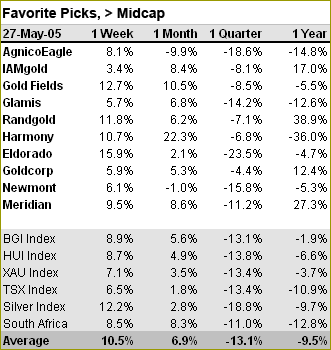 The
arithmetic mean gold stock return (of the 25 producers that comprise
most of the world’s production, and gold sector averages) came
in at more than 10 percent – boosted by huge gains in the silver
shares, Durban Deep (+32%), Bema Gold (+20%), Eldorado, Gold Fields and
Harmony (see the table to the right)… the median return was closer
to about 9 percent. It was the best weekly gain for this sector in more
than eight months – since the break out move last August that preceded
the subsequent rally up to near the old highs. Technically the
move is a reversal, but only a short term one for now, as already
suggested above.
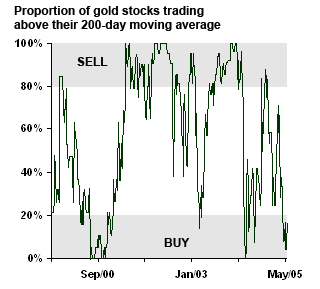
Meaningful short term resistance in the HUI comes into play between 200 and 225, but intermediate resistance is at 258. More than 80% of the sector is still trading under its 200-day (or 40-week) moving average (see graph next page), which is exactly opposite to the state of affairs in November when more than 80 percent of the sector was trading happily above this moving average. Barrick, Randgold, Meridian, and Goldcorp are the only ones in the midcap and senior group trading above their 40-week moving average – we own three!
 The
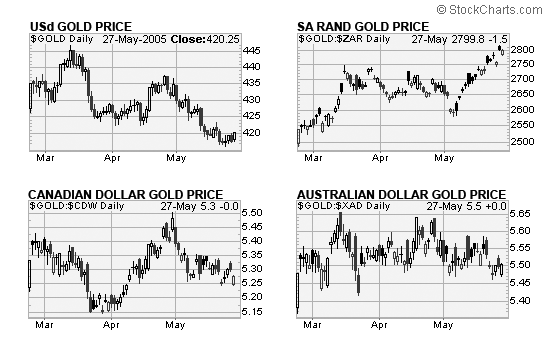
foreign currency price of gold is still a little soggy but it is firming
up at the margin. In the graphs below, for instance, you can see why the
South African equity sector has been recovering some of its lost luster.
If it keeps going the second and third quarter earnings comparisons are
going to favor the South Africans so long as operating costs don’t
continue to increase at the pace they had in the previous two years. Since
we are bullish on gold prices overall, since the Rand is one of the most
marginal of currencies, and since this end of the sector has been beaten
down so badly the current advance could be the beginning of something
with legs.
I would consider overweighting this group at this time. However, though it is very tempting to shift a greater weight to the gold share component of my overall allocation here, I am comfortable with the current weighting relative to bullion (gold equities = 25%; gold bullion = 40%; the remainder is a stock and bond short).
Gold Share Valuations Back in Line
with POG
Another attractive factor for the gold sector is gold share valuations.
There are basically three ways to value gold stocks: 1) by the net asset value of future cashflows, 2) current cashflow multiples, and 3) reserves. I tend to prefer #2 because #1 involves more assumptions about the future than are possible to forecast, and #2 tends to include the market’s subjective evaluation of the future anyway (K.I.S.S.).
As for #3, I believe that is a long term barometer of value that isn’t very relevant – especially when it comes to timing purchases/sales.
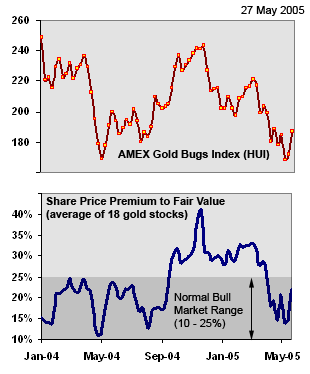
Based on the current cashflow multiples of about 18 gold producers I guesstimate that the market is discounting about a US$500 gold price, which is down from about US$620 back in November, representing about a 20 percent retracement in valuations on an 8% decline in USd gold prices since then. The main assumption that goes into the calculation is that fair value equals a 12 times operating cashflow multiple, which is slightly less than the long term average for both Newmont and Barrick. In my calculation of fair value for each producer I make adjustments for cash balances and outstanding hedges.
 However,
one weakness in this statistic is that for the growth producers (such
as Glamis and Eldorado) I do not adjust for the premium multiples the
market assigns to expected growth.
For example, the implied gold price for Glamis, Eldorado and Bema Gold, according to their share multiples, ranges from US$800 to US$1,300 per ounce – but that is mainly because their multiples include the expected growth in production. On the other hand, Newmont and Agnico Eagle’s share valuations imply a US$390 gold price, Meridian’s share price implies a US$450 gold price, and Goldcorp’s share values suggest a US$600 gold price, while Gold Fields and Harmony are trading at levels implying current gold prices (US$415-455).
These figures are also a little bit on the conservative side because they do not include the last two quarters worth of cashflows – which have shown modest improvements. In any case, it is only a simplistic calculation.
I have only been recording this statistic in the aggregate for about 12 months but I have monitored it for the individual shares since 2000 (I’m still fine tuning it also).
Prior to 2001 the normal range for this statistic was a discount to fair value of up to 20 percent; but once the bull market began the statistic fluctuated between about fair value and a 25% premium to fair value, on average.
I doubt very much that in the normal course of events these shares will trade at a discount until the bull market is over – or occasionally for the brief period of time that constitutes a primary liquidation of which I expect about two or three during the bull market (the first one should occur after we get our buying climax in gold prices).
The run up in this statistic to 40% during Q4 last year has been the main impediment to the gold share sector in my opinion. I’ve discussed this before, but basically it just means what you already know: that operating costs increased at a faster pace than gold prices (and hence revenues) during 2004.
The resultant cashflow squeeze caused cashflow multiples to rise because share prices did not fall as fast as profit margins, in most cases. The recent decline in this statistic then makes gold shares attractive again, at the curre nt gold price. Granted, not cheap… but probably about as cheap as they can get barring the primary correction scenario.
The best way to interpret this statistic, in my view, is that below 20 percent it is fair to expect the gold shares to outperform gold; whereas at above 20 percent we should expect to see them underperform gold prices.
Commitments of Traders Report,
the Long and Short of It
Friday’s rally in the gold sector was probably related to bullish
figures released by the CFTC on the structure of the gold market for the
week ended May 24, 2005, which revealed that the commercial net short
position fell to its lowest level in four months (22%); the large speculators’
net long position fell to its lowest in three months.
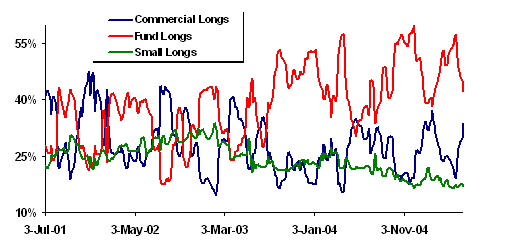
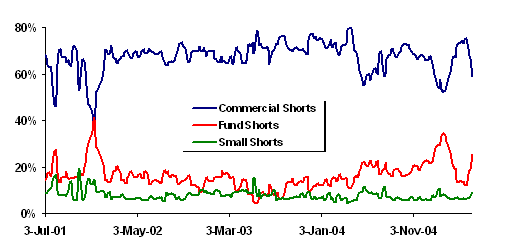
In the latest week (ending Tuesday) total open interest fell by about 2,000 contracts to 272,748. The funds, and other large speculators, liquidated about 17,000 contracts (of which about 7,000 constitute an addition to their short positions); the commercials (usually the banks and producers) offset that and then some by buying 20,000 contracts (half long and half represented a short cover).
The commercials are notoriously and ironically wrong on gold in the long term (since in most contracts the “commercials” tend to lead the market), but they have been quite adept at buying weakness and selling strength at the right time in the short run.
In the graphs above you can see that the funds (large speculators) have owned between 40 and 50 percent of the outstanding contracts on the COMEX during most of the past two years; that their long position is at the low end of that range at the moment; and that they have been shorting more frequently in the same period.
The commercials, on the other hand, have been reining in their shorting activity and adding to their longs; while the small specs (odd-lotters) have continued to abandon their long positions in favor of shorting the metal – their net long position fell to its lowest level since 2001. Since the Bull Run began that year the commercial net short position has ranged from about 19 to 62 percent (so the current 22% figure is bullish), while the speculative net long position has ranged from about 8 to 45 percent (the current figure is 14%, which is relatively bullish also). We have pointed out several times over the past few months that the structure of this market is bullish – which means that it is still mostly in strong hands, which in turn implies limited downside.
It is interesting, in fact, that the trend in gold prices is still firmly up, that they are only US$35 away from new 17-year highs, and yet, that the speculative net long positions are significantly off their highs, while the pros are still backing up the truck. The strong hands are still buying; the weak hands aren’t. Period. This you all know, I hope.
Conclusion:
The bullish facts for the gold sector are as follows:
- Gold is undervalued in terms of the other commodities – gold ratios still at multi-year lows
- Weak hands out, strong hands accumulating
- Gold and gold share technicals still largely bullish
- Sentiment: has turned bearish, remaining bulls have wrong focus, bullish case not factored
- Marginal gold producing currencies (like the South African Rand) are weakening again
- Gold shares have decoupled from the broader stock market averages (Dow & SPX)
- Gold share move last week was the best advance in over a year
- Gold share valuations back at attractive levels
- Global gold production contracting, pace of de-hedging continues, metal generally scarce
- Stock markets wobbly, potentially topping
- Oil prices could be set for new highs (on possible political events in Saudi Arabia)
- Fed is behind the curve and still accommodative; as well, money supply is growing fast again
- Forex movements are less relevant at this point
- French referendum on EU constitution is bullish either way
- Changes at Fed, including Greenspan’s departure
- Seasonal trends turning in gold bulls’ favor
The bearish facts include the possibility that the gold share technicals are more bearish than I am suggesting (i.e. they reflect scenario #1); that there is a possibility that foreign exchange rates are indeed still relevant and the USd is about to rally harder than I expect it to; and lastly, the possibility exists that I have underestimated the strength of the economic recovery (doubt it), and the major stock market averages make new highs. Regarding interest rates, I do not believe that they will rise very fast until gold prices rocket through US$500, and even then it would be more bearish for stocks and bonds than gold. And as for the CPI and PPI, I don’t care.
When they start coming in strong, I’ll probably be selling some of my gold… because that’s the news the weak hands like to buy! If clients are underweight and have been waiting for an opportunity to get back on board, now’s the time.
P.O. Box 4642
V.M.P.O.
Vancouver, BC
Canada
V6B 4A1
Phone: 1-604-941-7059