|
|

Oct 31/03 Comment:
Our gold share index fell 3
percent despite the 10% gain in the HUI, the 8% gain in the
XAU, and the 7% gain in the Canadian gold share index during
the month.
Agnico Eagle's 15% drop didn't do it alone.
Even with that our index was up 4%. What dragged it down
was the 8% tumble in Randgold's shares between when we added
the stock last week and month end, as well as the 5%
decline in Gold Fields' shares.
During October we made some changes to our gold stock index.
Anglogold and Goldcorp were replaced with Gold Fields and
Randgold resources as we saw more value in the new additions.
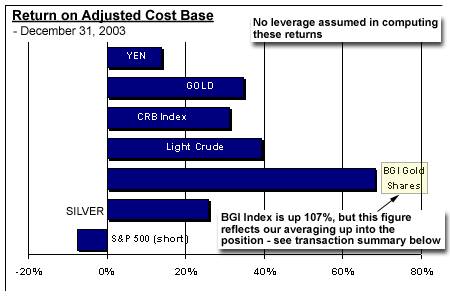
Over the past two years (since inception) our gold stock index
is up almost 100% - though our reported gain is only 38% because
of the impact on our cost base of averaging up into a 45%
allocation (from 10% in October '01, to 20% in December '01,
to about 30% in July 2002, and finally to 45% of our overall
allocation last October).
In August we reduced our allocation to gold shares by 1/3
on account of the opportunity we saw in the bullion markets.
In other words we expect bullion to outperform the equities
in the short to medium term. The plan is to increase the allocation
(to equity) again once the Dow collapses!
When we began accumulating our gold stocks our weighting
went to the North American producers on account of the hypothesis
that the US dollar price of gold would rise fastest, and that
there was some newly evolving political risk related to the
South African shares at the time. We were right, but since
then the valuation divergence between US and foreign gold
shares has grown enormously enough to entice us to shift our
weighting away from the US producers.
In September we also initiated a short against the S&P
500 after closing our original short in October 2002 (established
October 2001 at 1118, and bought back at an average 881 for
a 22% gain excluding leverage and commissions). Currently
we view this short position as a hedge for our gold share
longs on the premise that the gold sector and broad market
have been traveling upwards together, and on account of our
bearish conviction that the timing is right to be short.
After sitting out the US dollar's bear market over the past
year, the Yen has begun to perform well; it's become a leading
currency since September. The accepted reasons are official
jawboning by the Treasury department that was interpreted
bearishly for the greenback.
But more likely, the yen's spring to life is related to the
customary / expected market reaction to the relentlessly stubborn
and stupid Japanese policy of capping the yen during a US
dollar bear market - when prices are below market, demand
rises... Say's Law! Uh, economics 101.
Of course, anyone that didn't pay attention in the most basic
of economics classes was likely to become a bureaucrat anyway,
right?!
For a serious gold price correction to occur, the US dollar
"outlook" must improve. That means it doesn't matter if the
dollar itself bounces or not, you'll know the dollar outlook
is improving if gold prices fall during the bounce.
We don't see anything on the horizon that could improve the
US dollar outlook, except if we're wrong about the bear market
outlook for the broader market - both in direction and relative
strength. Gold prices seem poised to confirm January's primary
bull market break out as well as September's intermediate
breakout, and I believe they will just as the currency focus
shifts back to a bearish view of the US dollar from a positivist
view of the foreign currencies.
It's possible (in our outlook) that nothing will happen in
November, and gold prices sway back and forth, then break
out in December. My gut says December and January will be
good months for gold.
DISCLAIMER
|
|
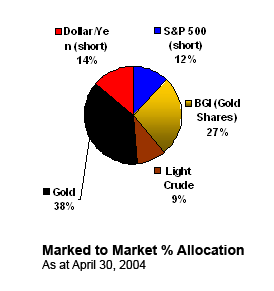
| As of 31 OCT 2003 |
Last |
Allocation |
1 month |
Return
on ACB |
View
Transaction History |
| Silver |
$5.07 |
9% |
- 1.4% |
+ 7% |
| BGI Gold index |
21.42 |
30% |
- 3.1% |
+ 38% |
| Light Crude |
$28.95 |
7% |
- 0.9% |
+ 24% |
| CRB index |
247 |
4% |
+ 1.2% |
+ 26% |
| Gold Bullion |
$385 |
28% |
- 0.4% |
+ 24% |
| S&P 500 - short |
1051 |
8% |
- 5.5% |
- 4% |
| Dollar/Yen - short |
110 |
14% |
+ 0.9% |
+ 11% |
| |
|
|
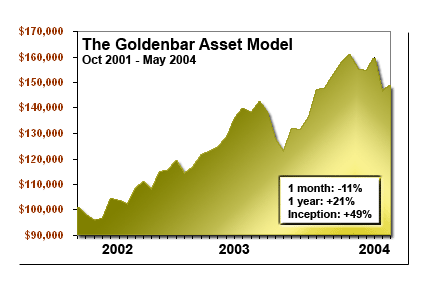
Explanation of Model:
The model, or
hypothetical portfolio, was originally conceived on May 24,
2001, but at the time only included four broad asset classes:
physical bullion, cash, fixed income, and equities (and only
from a long perspective). It was inflexible and we found that
it obscured our market calls in some of the commodities, the
fiat currencies, and on the short side of the equities markets.
Brave souls that we are we decided to make the model more
flexible and useful, to the trader in particular. With the
introduction of the Daily Outlook in October we found that
the old model was even less relevant. Still, changes will
not necessarily occur in response to our short-term (daily)
outlook unless the move has implications for the medium (intermediate)
term. Our hypothetical investor / trader has a big picture
outlook and adjusts his portfolio to capture the three to
nine month trends that technical analysts refer to generally
as intermediate trends.  Our
thinking is that these are the most important ones to you
as well. In each issue of the Global Investment Climate we’ll
assess the performance of our distribution, or at least if
it so requires. Our
thinking is that these are the most important ones to you
as well. In each issue of the Global Investment Climate we’ll
assess the performance of our distribution, or at least if
it so requires.
Take heed, however, that we
are neither a registered nor an unregistered advisory service,
and that the utility of this model is to reconcile our analysis
and highlight conclusions about our outlook for the various
asset classes. See DISCLAIMER
below. Thus, we are an analytical tool, not an advisory service.
Markets
Covered:
- Currencies:
Dollar/Gold, Dollar/Yen, Dollar/Euro, Dollar/Canada, and
the Dollar Index
- Commodities:
Silver, Platinum, Palladium, HG Copper, Wheat, Lumber, Light
Crude Oil, Natural Gas, Coffee, Cocoa, and maybe Cattle
- Cash
= 30 day T-bill money
- Fixed Income:
US Treasury bonds/notes - 5, 10, and 30 year US Treasuries
- Equities:
S&P500, Dow Industrials, Nasdaq, Nikkei, TSE 300, Euro
Top 100 index futures, as well as any of the US stock sectors
 When
and if we trade our model, we usually do it through forward (futures)
contracts for their liquidity, flexibility with respect to being
short or long, and stronger correlation with the underlying asset
(than options for instance). When
and if we trade our model, we usually do it through forward (futures)
contracts for their liquidity, flexibility with respect to being
short or long, and stronger correlation with the underlying asset
(than options for instance).
Leverage can be managed this way,
but there are other risks, which you must absolutely check with
your registered stock or bond broker. If you've never traded futures
I'd personally recommend a visit to the Chicago
Mercantile Website. They offer introductory courses at the following
link:
Introduction
to Futures (before you trade)
The only assets our hypothetical
investor takes a position in, which there are no forward contracts
available for, are the stock sectors, such as the XAU, or
AMEX oil index, or S&P agricultural products index, etc.
In this case it is assumed that the investor can buy or sell
the index as if there were futures traded on it. In practice,
hedge funds would buy or sell a sector by buying most of its
components, at least the ones that weigh heavily in the particular
index. Moreover, we do
not use stop losses, but recommend discussing with your broker
whether it would be appropriate for you to do so.
Other Codes:
- NEGATIVES indicate only
that our investor is short something, rather than long. They don't
add up mathematically. For example, 30% + -30% = 60% of the portfolio
has been allocated. They do not cancel each other out, as if they
were simply added or subtracted.
- VALUES are calculated using
the price of the asset on the opening or closing trade as reference
points.
- The BUGOS GOLD INDEX
is an unweighted gold index, which includes an originally
equal value allocation in between Newmont, Franco Nevada (replaced
by Anglogold in February 2002), Placer Dome (replaced by Goldcorp.
July 17, 2002), Agnico Eagle, and Harmony Gold mining, ranked
accordingly and with respect to their simple statistical influence
on this index.
BGI Gold
Index Most Current Composition = NEM + GFI + GOLD + AEM (sold
@ US$12) + KGC
Lastly, since the world is on a dollar
standard, we see all currencies in those terms. It is professional
to say Dollar/Yen rather than "I am trading the yen."
The reason is that one can trade the yen against the euro, or pound,
or perhaps even the CAD these days. Also, by choosing one standard
such as that, we can see that the negatives in the currency category
always indicate a short position against the dollar while the positives
indicate long positions in the dollar, against whatever we specify.
DISCLAIMER:
The Goldenbar Report is not a registered advisory service
and does not give investment advice. Our comments are an expression
of opinion only and should not be construed in any manner
whatsoever as recommendations to buy or sell a stock, option,
future, bond, commodity or any other financial instrument
at any time. While we believe our statements to be true, they
always depend on the reliability of our own credible sources.
Of course, we recommend that you consult with a qualified
investment advisor, one licensed by appropriate regulatory
agencies in your legal jurisdiction, before making any investment
decisions, and barring that, we encourage you to confirm the
facts on your own before making important investment commitments.
|
Light Green = Entry
Transactions
Light Red = Closing Transactions
Units may be odd lot, but is irrelevant for a hypothetical
account like this one.
|
|
24-May-01
|
|
|
|
|
|
|
|
107 oz
|
|
279.00
|
Bullion
|
107 ounces
|
|
|
333 units
|
|
59.00
|
XAU
|
333 units
|
|
|
$50,000
|
|
|
Tbills
|
$50,000
|
|
12-Jul-01
|
|
|
|
|
|
|
|
78 oz
|
|
267.00
|
Bullion
|
185 ounces
|
|
|
182 units
|
|
54.00
|
XAU
|
515 units
|
|
|
|
$ 30,000.00
|
|
Tbills
|
$20,000
|
|
7-Oct-01
|
|
|
|
|
|
|
|
|
340 units
|
58.00
|
XAU
|
175 units
|
|
|
20 units
|
|
515.00
|
XOI
|
20 units
|
|
|
|
$15,000
|
106-25
|
30
year bond
|
($15,000)
|
|
|
11 oz
|
|
427.00
|
Platinum
|
11 ounces
|
|
|
445 barrels
|
|
22.48
|
Crude
|
445 barrels
|
|
|
50 units
|
|
192.00
|
CRB
|
50 units
|
|
|
$10,000
|
|
0.83
|
Yen
|
$10,000
|
|
|
$5,000
|
|
0.92
|
Euro
|
$5,000
|
|
|
|
95 oz
|
292.00
|
Bullion
|
90 ounces
|
|
|
|
$ 20,000.00
|
|
Tbills
|
CLOSED
|
|
9-Nov-01
|
|
|
|
|
|
|
|
|
18 units
|
1,118.00
|
S&P
500-short
|
18 units
|
|
|
$15,000
|
|
110-18
|
30
year bond
|
CLOSED
|
|
|
|
$20,000
|
111-07
|
10
year bond
|
($20,000)
|
|
|
|
11 oz
|
420.00
|
Platinum
|
CLOSED
|
|
|
|
50 units
|
189.00
|
CRB
|
CLOSED
|
|
|
|
$ 5,000.00
|
|
Yen
|
$5,000
|
|
|
|
$ 5,000.00
|
|
Euro
|
CLOSED
|
|
13-Dec-01
|
|
|
|
|
|
|
|
|
175 units
|
54.00
|
XAU
|
CLOSED
|
|
|
$10,000
|
|
104-16
|
10
year bond
|
($10,000)
|
|
|
1585 units
|
|
12.62
|
BGI
|
1585 units
|
|
14-Jan-02
|
|
|
|
|
|
|
|
$10,000
|
|
106-20
|
10
year bond
|
CLOSED
|
|
|
26 units
|
|
195.75
|
CRB
|
26 units
|
|
|
$5,000
|
|
0.76
|
Yen
|
$10,000
|
|
23-May-02
|
|
|
|
|
|
|
|
|
20 units
|
558.00
|
XOI
|
CLOSED
|
|
|
0.93 units
|
|
11,980.00
|
Nikkei
225
|
0.93 units
|
|
10-Jul-02
|
|
|
|
|
|
| |
|
0.93 units |
10,936.00* |
Nikkei 225 |
CLOSED |
| |
32 oz |
|
317.60 |
Bullion |
122
ounces |
|
11-Jul-02
|
|
|
|
|
|
| |
9 units |
|
927.00 |
S&P 500-short |
9
units |
| |
773 units |
|
19.67 |
BGI gold shares |
2358
units |
| 14-Oct-02 |
|
|
|
|
|
| |
714 units |
|
17.66 |
BGI Gold Shares |
3072
units |
| |
9 units |
|
835.00 |
S&P 500-short |
CLOSED |
| 18-Nov-02 |
|
|
|
|
|
| |
120 bbl |
|
26.42 |
NYMEX Crude |
565
barrels |
| |
|
10 oz |
319.00 |
Bullion |
112
ounces |
| 25-Nov-02 |
|
|
|
|
|
| |
1385 oz |
|
4.43 |
Silver |
1385
ounces |
| |
|
19 oz |
318.00 |
Bullion |
93
ounces |
| 27-Feb-03 |
|
|
|
|
|
| |
|
211 bbl |
38.00 |
Crude |
354
barrels |
|
|
23 oz |
|
348.40 |
Bullion |
116
ounces |
| 10-Jul-03 |
|
|
|
|
|
| |
$8,944 |
|
117.50 |
Yen |
$18,944 |
| |
|
26 oz |
344.00 |
Bullion |
90
ounces |
| 29-Aug-03 |
|
|
|
|
|
| |
|
1024 units |
22.41 |
BGI Gold Shares |
2048
units |
| |
15 oz |
|
377 |
Gold (bullion) |
105
ounces |
| |
1132 oz |
|
5.14 |
Silver (bullion) |
2517
ounces |
| |
|
$11,474.92 |
1005 |
S&P 500 (short) |
11.42
units |
|
| BACK TO THE TOP |
|

